
Table of Contents
- 1. What This Guide Covers
- 2. Why Predictability Matters Now
- 3. How B2B Buyers Actually Make Decisions
- 4. The Economic Case for Inbound
- 5. The Five Components of a Predictable Inbound System
- 6. Measuring What Matters
- 7. System-Driven vs. Opportunistic: The Key Difference
- 8. Common Failure Modes
- 9. What This Means for Executive Decisions
- 10. Key Takeaways
- 11. FAQs
 Feb 27, 2026 ·
  15 min read ·
  Summarize in ChatGPT
What This Guide Covers
Most B2B marketing teams measure inbound success by traffic and lead counts. But executives need something different: a clear line from marketing activity to pipeline and revenue.
This guide shows how to build an inbound lead generation system, not just a content program, that produces steady, forecastable results. You’ll learn how to structure content, search, conversion, and measurement so that inbound becomes a growth engine you can plan around, not a set of campaigns you react to.
The approach here draws on research from HubSpot, Gartner, McKinsey, Forrester, and Demand Gen Report. It’s built for B2B and professional services organizations where sales cycles are long, buying decisions involve multiple stakeholders, and deal values justify the investment in getting this right.
Why Predictability Matters Now
B2B marketing has shifted. Executive teams no longer accept brand awareness or engagement metrics as proof of value, they want to see how marketing contributes to pipeline and revenue.
This shift reflects how buyers actually behave. Most buying teams research independently before contacting sales. They compare options, assess risk, and form preferences through digital channels long before a sales conversation happens.
The pressure is real: board reports increasingly focus on how many opportunities marketing influenced, how quickly those opportunities moved through the pipeline, and how much revenue followed.
Yet many organizations still explain inbound performance through traffic and campaign reports. They track page views, form submissions, and cost per lead. These measures show activity but miss the bigger picture. A company can generate plenty of leads while struggling with weak opportunity quality, long sales cycles, and low close rates. Inbound looks busy but doesn’t support reliable growth.
The solution isn’t more content or better campaigns. It’s treating inbound as a system, one with clear rules for how demand enters, moves through qualification, and connects to revenue.
How B2B Buyers Actually Make Decisions
Before building your system, you need to understand what you’re designing for.
Buying Is a Group Activity
B2B purchasing isn’t a single person moving through a funnel. It’s a group of six to ten stakeholders working through learning, validation, and alignment tasks, often at the same time. Finance reviews budget impact while technical staff assess feasibility and business leaders evaluate strategic fit.
This creates nonlinear patterns. Buyers enter at different points, pause for internal discussions, and return to research after meeting with suppliers. Traditional funnels that assume steady progression from awareness to conversion don’t reflect reality.
Most Research Happens Before Sales Contact
The numbers are striking: 80% of B2B buyers initiate first contact with sellers when they’re already about 70% through their buying process. By the time they talk to your sales team, most of the evaluation and trust-building has already happened.
Where does that work occur? In digital and content-driven channels. Buyers typically review three to seven content resources before starting a sales conversation. They use search engines, industry publications, peer networks, and analyst content to understand problems and identify solution categories.
Buyers Arrive with Preferences Already Formed
Here’s what makes early visibility critical: 92% of B2B buyers begin the purchase process with at least one vendor already in mind, and 41% identify a preferred vendor before formal evaluation begins.
If you’re not present during independent research, you may never make the consideration set.
What This Means for Your System
Your inbound system needs to support repeated entry, varied information needs, and extended evaluation periods. It needs to reach multiple stakeholders with different concerns. And it needs to build credibility during self-directed research, not just capture contact information.
The Economic Case for Inbound
Understanding the economics helps you make the investment case and set realistic expectations.
| Dimension | Inbound | Outbound |
|---|---|---|
| Cost structure | Higher upfront, lower marginal cost over time | Scales with volume; cost rises with each outreach |
| Buyer intent | Buyer initiates; demonstrates active research | Seller initiates; need must be confirmed |
| Qualification burden | Lower — buyers self-select through content use | Higher — requires heavy early qualification |
| Sales cycle | Often shorter due to prior research | Often longer due to cold entry point |
| Scalability | Grows with content library and search visibility | Requires proportional budget increases to scale |
| Best suited for | Long sales cycles, multiple stakeholders | Targeted account outreach, defined prospect lists |
How Costs Work Over Time
Inbound and outbound programs distribute costs differently. Outbound spending rises with volume, each additional contact or outreach effort increases expense. Inbound concentrates more spending upfront on content, search visibility, and system setup. After you build that foundation, the cost of capturing additional demand typically falls.
This means early inbound programs often show higher cost per lead. You’re investing in content development, platform setup, and workflow design before demand grows. As content libraries expand and search visibility improves, the same system attracts more qualified traffic without proportional increases in spending.
Why Cost-Per-Lead Misleads
Cost-per-lead measures the expense of generating a contact, not the value of that contact. A low-cost lead that never converts can appear efficient while producing nothing. A higher-cost inbound lead that progresses through the pipeline and closes delivers real return.
Better measures tie to opportunity value, stage conversion, and deal outcomes, not lead volume alone.
The Pipeline Contribution Difference
Inbound and outbound also differ in what they produce. Outbound often generates early-stage opportunities requiring heavy qualification to confirm need, budget, and authority. Inbound more often surfaces buyers who demonstrate intent through search behavior, content use, or direct information requests.
Buyers engage in an average of 27 interactions during a purchase process, and 60% of B2B purchases involve groups of four or more people. Inbound touchpoints appear across several stages of the revenue path, not just at first contact.
When you treat inbound as a system supporting buyer learning, sales readiness, and pipeline flow, you can model performance in terms of forecastable revenue, aligning marketing investment with financial planning and growth goals.
The Five Components of a Predictable Inbound System
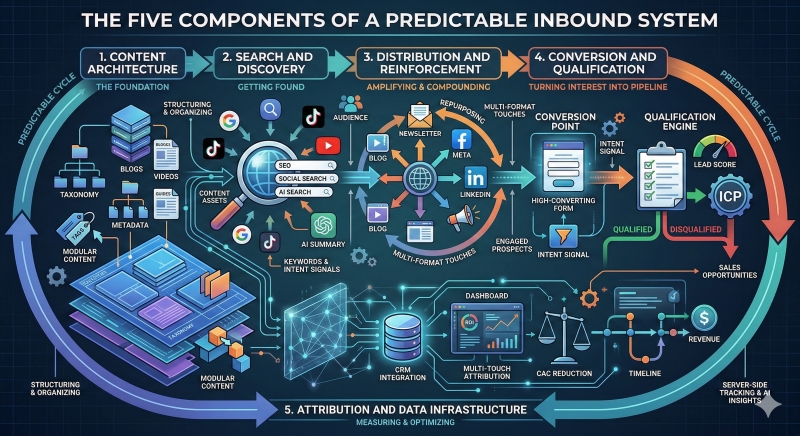
Predictable inbound relies on connected components, not isolated tasks. Each captures buyer intent, guides evaluation, and links marketing activity to sales.
Content Architecture
Content is the primary point of contact between buyers and your system. Its role goes beyond attracting visits, it frames problems, outlines options, and supports decisions across buyer stages.
Problem framing matters most. Buyers often struggle more with internal alignment and problem definition than with product comparison. Content that explains business risks, operating limits, or market conditions helps buyers clarify what they need before reviewing solutions.
Align content to buyer stages:
- Early-stage content supports problem recognition and context
- Mid-stage content supports comparison and evaluation
- Late-stage content supports justification, risk review, and internal approval
When you skip this structure, you attract interest without moving buyers toward readiness. Topic gaps lead to missed connections even when other parts of your system perform well.
Search and Discovery
Search visibility is your primary capture point for active demand. Buyers research online to ask questions, compare options, and find supporting information.
Match search coverage to buyer tasks, not internal product categories. Keyword intent reflects buyer stage:
- Informational searches indicate early learning
- Comparative searches point to evaluation
- Transactional or contact-focused searches signal readiness to engage
A buyer who finds a technical guide during early research may read in depth but avoid forms or sales contact. The same buyer may respond to a later-stage search that leads to a case example or pricing page. Rankings alone don’t explain search performance, you need to link keyword groups to downstream actions and pipeline movement.
| Buyer Stage | Primary Goal | Content Types | Search Intent |
|---|---|---|---|
| Early (Problem Recognition) | Understand the problem | Research reports, educational guides, blog explainers | Informational |
| Mid (Evaluation) | Compare options and assess fit | Case studies, comparison guides, product overviews | Comparative |
| Late (Justification & Approval) | Build internal consensus | ROI calculators, risk assessments, implementation guides | Transactional |
Distribution and Reinforcement
Distribution channels extend reach beyond search. Email programs, professional networks, and account-based exposure reinforce earlier interactions during extended evaluation periods. They keep you visible while buyers hold internal discussions or seek outside input.
Email supports structured follow-up. Sequence material by buyer stage to guide contacts through learning paths rather than sending general updates.
Coordinate with sales outreach. When your system flags strong intent, repeated use of late-stage material, for example, sales teams can make focused contact instead of broad prospecting. Marketing and sales should share visibility into buyer behavior and work from the same demand view.
Conversion and Qualification
Conversion design affects data quality and sales efficiency. Forms and offers control what information enters your system and how teams judge readiness.
Balance volume against context. Simple forms raise volume but capture contacts with little context. Detailed forms add context but lower response rates. Progressive profiling collects information across multiple interactions.

Use offer type to signal stage. Early-stage offers like guides or research summaries capture general interest. Later-stage offers like assessments or consultations signal readiness for direct contact.
Separate marketing-qualified from sales-qualified signals. Marketing-qualified signals reflect engagement: content use or repeat visits. Sales-qualified signals show intent: pricing requests or solution discussions. When you treat both identically, sales teams receive contacts without budget authority or internal support. Apply clear rules for when contacts move from marketing workflows to sales ownership.
Attribution and Data Infrastructure
Data infrastructure links inbound activity to revenue results. Your CRM and marketing automation systems need to record interaction history, track movement through pipeline stages, and connect marketing to closed deals. Without this link, you can report engagement but can’t measure financial impact.
| Attribution Model | How It Works | Best Used When | Limitation |
|---|---|---|---|
| First-touch | Credits the first interaction | Measuring awareness and top-of-funnel reach | Ignores all mid and late-stage influence |
| Last-touch | Credits the final interaction before conversion | Measuring what closes deals | Ignores early research that built preference |
| Multi-touch (linear) | Distributes credit equally across all touchpoints | Long sales cycles with multiple interactions | Treats all touchpoints as equally important |
| Stage-based | Weights credit by pipeline stage (e.g., more to opportunity creation) | Complex B2B sales with defined pipeline stages | Requires clean, consistent CRM data |
Choose attribution models that match your sales cycle. First-touch and last-touch models credit a single step in a longer process. Stage-based and multi-touch models distribute value across steps like early research, evaluation, and sales contact, better reflecting how marketing supports opportunity quality and deal movement in long sales cycles.
Process consistency matters as much as model choice. When sales teams skip stage updates or marketing systems apply inconsistent tags, results lose reliability. Establish shared definitions for pipeline stages, opportunity status, and revenue outcomes.
Measuring What Matters
Executive oversight requires a measurement framework linking marketing activity to financial results, not just traffic and lead counts.
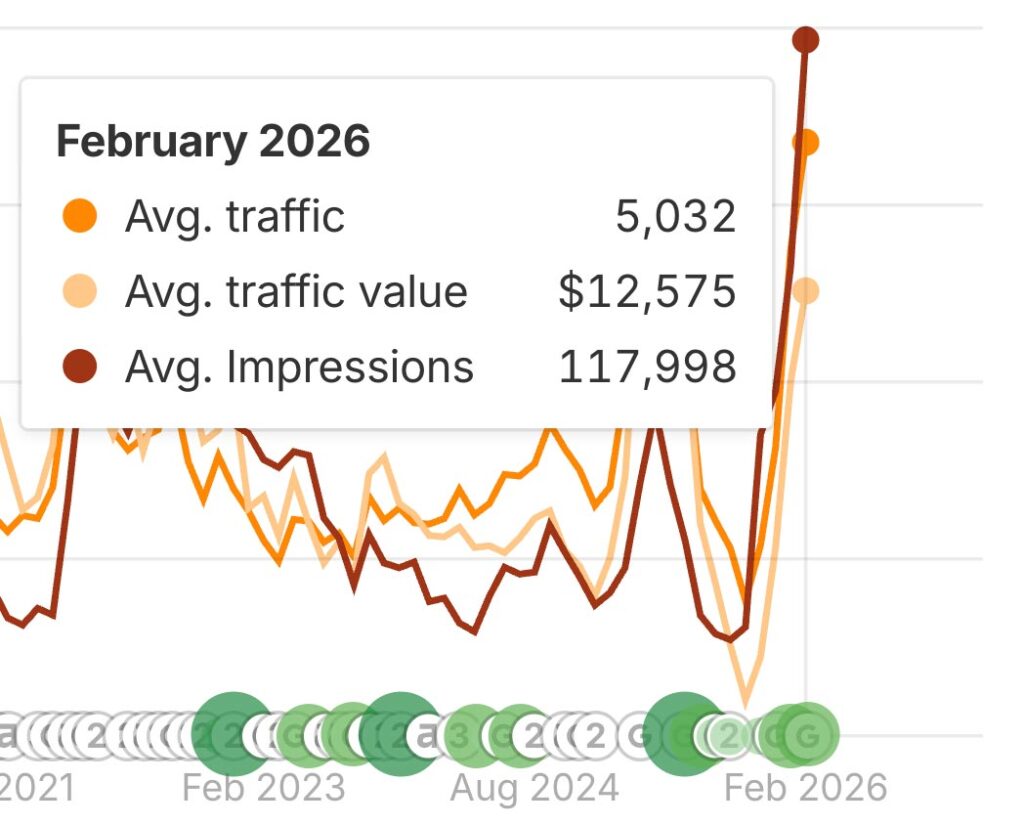
Move Beyond Vanity Metrics
Traffic and impressions measure exposure, not business impact. A rise in visits may follow broad topic coverage or short-term promotion without indicating buyer readiness.
Lead counts create a similar gap. Many contacts can enter your system while only a small share become qualified opportunities. When you rely on these measures, you see activity without clear business meaning.
Table 2: Vanity Metrics vs. Revenue Metrics
| Vanity Metric | Why It Falls Short | Better Alternative |
|---|---|---|
| Website traffic | Measures exposure, not buyer intent | Pipeline value influenced by inbound |
| Lead count | Counts contacts regardless of quality or fit | Marketing-qualified to sales-qualified conversion rate |
| Cost per lead | Ignores whether leads ever convert | Cost per closed deal by source |
| Page views | Shows activity, not engagement depth | Stage conversion rate and time in stage |
| Form submissions | No context on readiness or fit | Sales acceptance rate of inbound leads |
The Metrics That Matter
Pipeline value influenced by inbound. Track the total value of opportunities that include inbound interactions at any point in the sales path, not just first contact. Marketing activity commonly appears at multiple points in long B2B sales cycles.
Stage-based conversion rates. Track how contacts move through defined steps: initial engagement, marketing qualification, sales acceptance, opportunity creation, and close. This reveals where demand slows or drops. Strong early engagement with weak sales acceptance often signals misalignment between content and sales criteria.
Sales cycle duration and velocity. Duration measures average time from first inbound interaction to closed deal. Velocity combines deal value, win rate, and cycle length to estimate how quickly pipeline converts to revenue.
Win rate comparison. Separate inbound-sourced and outbound-sourced opportunities to see whether self-directed buyers close at higher or lower rates. Differences often appear in deal size, sales effort, and qualification burden.
Building an Executive Dashboard
An executive view should link marketing input to revenue output in a clear sequence:
- Layer one: inbound influence on pipeline value and opportunity count
- Layer two: stage-by-stage conversion and time in stage
- Layer three: closed revenue, win rate, and average deal size for inbound-related deals
Add trend views across quarters or years to support planning. When you include cost data, you can assess return on marketing investment in terms of revenue contribution.
Using Measurement for Forecasting
By tracking average conversion rates and cycle length by segment, you can estimate how many inbound contacts you need to meet a revenue target. This aligns marketing plans with sales capacity and growth goals, turning measurement into a management tool.
System-Driven vs. Opportunistic: The Key Difference
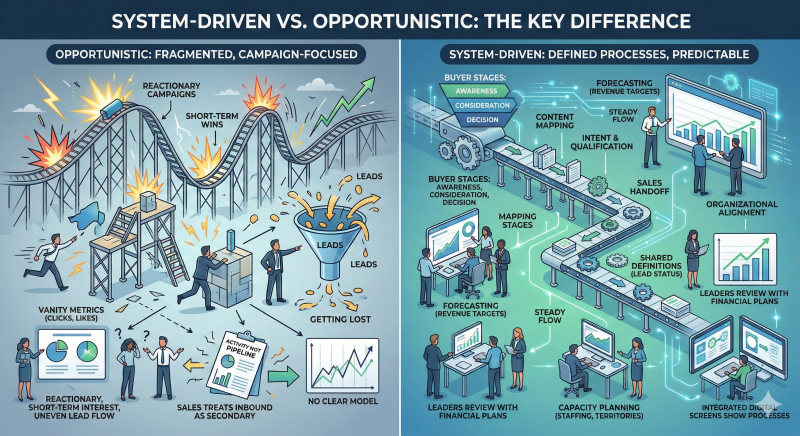
Organizations often describe inbound performance in campaign terms: spikes, drops, short-term wins. This reflects an opportunistic approach, reacting to trends, publishing based on short-term interest, tracking surface metrics, and changing direction without a clear model for how demand should flow.
These programs lack a stable baseline. Lead volume swings by month or quarter. Sales teams receive uneven flow and treat inbound as secondary. Reports focus on activity rather than pipeline movement. You can show strong engagement while offering little support for revenue planning.
What System-Driven Looks Like
System-driven programs follow defined processes. You set rules for how demand enters, moves through, and exits the system. You map buyer stages to content, search intent, qualification steps, and sales handoff points.
This creates steady flow rather than isolated responses to performance changes. When demand shifts, you can link the change to specific components, topic gaps, conversion issues, or follow-up timing.
Forecasting becomes possible. Track conversion rates and time in each stage, then use those values to estimate how many inbound contacts you need to meet pipeline and revenue targets.
Capacity planning improves. When you know how many opportunities inbound generates and how quickly sales can work them, you can adjust staffing, territory coverage, and account assignments.
Organizational alignment follows. Marketing, sales, and revenue operations need shared definitions for lead status, opportunity stages, and revenue results. In a system-driven model, leaders review inbound alongside sales performance and financial plans.
Common Failure Modes
Predictable systems depend on accurate data and consistent processes. Weakness in either area undermines performance and decision-making.
| Signal Type | Examples | Recommended Action |
|---|---|---|
| Marketing-Qualified (MQL) | Downloaded a guide, repeated site visits, email engagement | Enter nurture sequence; continue content delivery |
| Sales-Qualified (SQL) | Requested pricing, booked a consultation, viewed ROI content multiple times | Route to sales for direct outreach |
| Disqualifying Signals | Wrong industry, wrong role, no budget indicators | Remove from active workflows; do not pass to sales |
Data quality breakdown. When sales teams don’t update opportunity stages or close dates, attribution loses accuracy. Marketing reports strong engagement while revenue reports show weak contribution, because outcomes weren’t recorded correctly.
Content-sales misalignment. Content can attract roles or industries outside your target profile. Marketing reports steady lead flow while sales sees low conversion and long qualification cycles. Without shared rules for readiness and fit, teams argue about lead quality instead of fixing the system.
Attribution blind spots. Many B2B deals last months or years and involve several stakeholders. Single-touch or short-window models miss early inbound influence and credit only late-stage sales work. This leads you to undervalue how inbound shapes demand and internal alignment.
Organizational resistance. Some sales teams view revenue-based marketing accountability as threatening. Marketing teams may resist deeper involvement in pipeline review. Without executive backing, reporting stays focused on activity rather than revenue impact.
External disruption. Market changes, regulations, and economic cycles shift buyer behavior in ways no system fully predicts. Predictable inbound reduces internal variation and improves visibility, but interpret results within broader context.
What This Means for Executive Decisions
Predictable inbound changes how you plan, budget, and manage.
Investment Planning
When you track conversion rates, sales cycle length, and opportunity value for inbound-sourced deals, you can estimate how much demand your system must produce to meet revenue targets. This aligns marketing budgets with growth plans the same way sales staffing aligns with quotas.
Fund system components, content coverage, search visibility, data tools, that support steady performance over time.
Budget Structure
Inbound requires higher upfront spending on platform setup, content creation, and process design. Over time, the cost of capturing additional demand falls as coverage expands and performance stabilizes.
Treat inbound as a long-term asset, like a sales enablement platform. Review returns over quarters and years rather than reacting to short-term swings.
Governance
Bring marketing, sales, and revenue operations into the same executive reviews. Pipeline reviews that include inbound influence, stage movement, and deal outcomes reduce siloed reporting.
When you review inbound performance alongside forecast accuracy and close rates, you reinforce shared responsibility for growth.
Board Communication
Present inbound as a managed demand engine that feeds revenue forecasts. This directs discussion toward capacity, market coverage, and long-term investment, not short-term traffic fluctuations.
You can test design changes, expanded topic coverage, revised qualification rules, and model how they affect pipeline volume and timing. This places inbound within the same planning discipline applied to sales operations and finance.
| Dashboard Layer | Metrics to Include | Business Question It Answers |
|---|---|---|
| Layer 1: Pipeline Influence | Inbound-influenced pipeline value, opportunity count | How much revenue did marketing help create? |
| Layer 2: Funnel Health | Stage conversion rates, average time in stage | Where is demand slowing or dropping off? |
| Layer 3: Revenue Outcomes | Closed revenue, win rate, average deal size (inbound vs. outbound) | Is inbound producing quality deals that close? |
| Layer 4: Efficiency | Cost per opportunity, cost per closed deal, sales cycle length | Is the investment performing over time? |
Key Takeaways
Inbound lead generation becomes predictable when you treat it as a revenue system rather than a content or campaign function.
Design around buyer behavior. Buyers research independently, involve multiple stakeholders, and form preferences before sales contact. Your system needs to reach them during self-directed research and support the full buying group.
Connect the components. Content captures and guides demand. Search intercepts active research. Distribution maintains engagement. Conversion and qualification manage readiness. Data links activity to revenue. Manage these as one system.
Measure what matters. Shift from traffic and lead counts to pipeline influence, stage conversion, sales cycle duration, and deal outcomes. This makes measurement a management tool.
Build for forecastability. Track conversion rates and cycle length so you can estimate how many inbound contacts you need to meet revenue targets. Align marketing plans with sales capacity and growth goals.
Secure organizational alignment. Marketing, sales, and revenue operations need shared definitions and shared visibility. Without it, you’ll have silos and arguments instead of a functioning system.
When you get this right, inbound becomes an asset you can plan around, supporting revenue forecasting, capacity modeling, and board-level growth discussions.
FAQs
Lead volume alone doesn’t indicate a healthy system. If you’re not tracking how leads move through pipeline stages, convert to opportunities, and close as revenue, you’re measuring activity rather than outcomes. Predictability comes from treating inbound as a connected system with defined rules for qualification, handoff, and measurement.
Research suggests buyers are roughly 70% through their decision process before initiating contact with a seller. Most will have already reviewed three to seven content resources and, in many cases, formed a preference for a specific vendor before formal evaluation begins.
Content should map to three stages: early-stage material that helps buyers recognize and frame problems; mid-stage material that supports comparison and evaluation; and late-stage material that aids justification, risk review, and internal approval. Gaps at any stage can break the connection between initial interest and sales readiness.
Focus on pipeline value influenced by inbound, stage-by-stage conversion rates, sales cycle duration, and win rates for inbound-sourced deals compared to outbound. These connect marketing activity to financial outcomes and support revenue forecasting.
Marketing-qualified signals reflect engagement behavior, such as content consumption or repeat site visits. Sales-qualified signals indicate intent, such as pricing requests or requests for a consultation. Applying clear, shared rules for this handoff prevents sales teams from receiving contacts who lack budget authority or internal alignment.
Inbound concentrates spending early on content creation, search visibility, and system setup. Once that foundation is in place, the cost of capturing additional demand typically falls as content coverage expands and rankings stabilize. Outbound, by contrast, scales costs with volume indefinitely.
This usually signals misalignment between the content attracting leads and the criteria sales uses to evaluate fit. Without shared definitions for readiness and target profile, the conversation stays focused on blame rather than diagnosis. Audit which content is driving conversions, compare those profiles to your ideal customer, and revise qualification rules together with sales.
Single-touch models like first-touch or last-touch miss most of the story in long sales cycles. Stage-based or multi-touch models distribute credit across key interactions — early research, mid-funnel evaluation, and sales contact — which better reflects how inbound influences opportunity quality and deal progression over time.
By tracking average conversion rates at each pipeline stage and average sales cycle length by segment, you can work backward from a revenue target to estimate how many inbound contacts your system needs to produce. This turns measurement into a planning tool and aligns marketing budgets with growth goals.
The most common failure points are inconsistent data entry by sales teams (which corrupts attribution), content that attracts the wrong audience, attribution models that undercount inbound’s influence, and lack of shared definitions between marketing, sales, and revenue operations. Executive backing is often required to maintain the organizational alignment these systems depend on.
Resources
- Demand Gen Report. (n.d.). B2B buyer behavior research.https://www.demandgenreport.com/resources/b2b-buyer-s-survey-economic-uncertainties-renew-buyers-focus-on-price-functionality/7938/
- Forrester. (n.d.). Marketing attribution and revenue impact.https://www.forrester.com/blogs/marketing-operations-impacts-revenue/
- Gartner. (n.d.). B2B buying journey and demand generation.https://www.gartner.com/en/digital-markets/insights/how-the-b2b-purchase-journey-is-evolving
- McKinsey & Company. (n.d.). B2B growth and demand creation.https://www.mckinsey.com/capabilities/growth-marketing-and-sales/our-insights/growth-amid-uncertainty-jump-starting-b2b-sales-performance
- HubSpot. (2023, December 1). How close rates are shifting in 2024.https://blog.hubspot.com/sales/new-sales-close-rate-industry-benchmarks-how-does-your-close-rate-compare
- Forrester. (2022, March 11). B2B Marketers: It’s Time To Ditch Sourcing Metricshttps://www.forrester.com/blogs/b2b-marketers-its-time-to-ditch-sourcing-metrics/
- Demand Gen Report. (2019). 2019 Content Preferences Survey Report.https://www.demandgenreport.com/resources/2019-content-preferences-survey-report/5585/#:~:text=68%25%20of%20respondents%20said%20they,%2Fuser%2Dgenerated%20feedback%3B%20and
Kim Greer
OFP Law
One of the best business decisions I ever made was to contract with 321 Web Marketing. Jonathan Gessert and his team are knowledgeable, efficient, and effective, making digital marketing goals easy to achieve and helping [...]
Kelly Cole
Business Benefits Group
My company hired 321 Web Marketing in February 2016 to resurrect our web site. We feel our web site is the face to our business and desperately needed a make over. 321 took us from blah to WOW effortlessly and what a difference [...]
Emily Hawkins
Diener & Associates
Thanks to 321 Web Marketing, the client has seen an increase in their search engine leads, averaging 12 qualified leads per month. The client has also achieved prominent Google Maps and search placement. The team manages the engagement [...]
Trevor Telesz
Paw Pals Pet Sitting
321 Web Marketing successfully translated the client’s design into a stunning and refreshed website, ensuring seamless functionality across all dynamic views. The team provided clear timelines and stuck to them, keeping everything [...]
Corey Davis
Spartan Animal & Pest Control
321 Web Marketing is truly phenomenal at what they do. Their ability to communicate and describe the steps and actions that they are implementing , Alex Zarpas in particular, is excellent. Delivering on promises is all they have done for me [...]
Alec Roberts
MFE Insurance
I can’t say it enough, Jonathan and his team have gone above and beyond since day one to accommodate our needs and meet our goals. I run a specialty insurance brokerage based in LA and once we found 321 we never looked [...]
Richard Wilbur III
Advantage.Tech
Thanks to 321 Web Marketing’s web development work, the client increased rankings and traffic from search engines. Also, their business secured prominent positions on Google Maps and industry-relevant, profitable keywords. The client also [...]
Bruce Gemmill
FVCbank
After the website revamp, the client saw a steady rise in leads from search engines, resulting in additional traffic. 321 Web Marketing is highly punctual when it comes to deliverables, and internal stakeholders are impressed with the service [...]
Drew Weeks
VAE
321 Web Marketing delivered a sleek website that accurately portrays the size and quality of the client’s organization. All of their completed websites have received positive feedback from users who have been impressed by the UX/UI. The [...]
Ryan Masten
Masten Pools
321 Web Marketing has increased the client’s leads from zero to 53 monthly. Their SEO efforts pay off impressively due to a top-ranking position on Google and making the site the number one result for several local service keywords. The [...]