
 Dec 10, 2025 ·
  6 min read ·
  Summarize in ChatGPT
Knowing how every advertising dollar translates into real revenue is the foundation of smart marketing decisions. A ROAS calculator helps you do exactly that, giving you a clear picture of how effectively your campaigns turn ad spend into real returns.
While the math behind it is simple, the insights gleaned depend on how you measure, compare, and act on the numbers themselves.
In this guide, you’ll learn how to:
- Build accurate inputs for your ROAS calculations
- Compare performance across Google Ads, Meta, and Amazon
- Interpret results to guide budget allocation and optimization
What ROAS Really Measures
Return on ad spend (ROAS) is the most effective way to understand how well your advertising is generating revenue. It measures the revenue generated for each advertising dollar spent and offers a clear indicator of how effectively your marketing investment drives sales.
The calculation itself is simple: attributed revenue divided by ad spend. What makes it powerful is how consistently you define and compare those numbers across platforms.
ROAS = Attributed Revenue ÷ Ad Spend
ROAS and ROI (return on investment) may seem similar, but they evaluate performance from different angles. Unlike ROAS, ROI encompasses the entire cost structure to reflect the actual financial return after all expenditures. It tells you how hard your advertising dollars are working, not how profitable the business is overall.
ROAS helps marketers evaluate channel performance, while ROI supports higher-level financial planning. For example, a campaign could have a high ROAS but still underperform if product margins are slim.
ROAS vs. ROI: These metrics are related but not identical.
- ROAS focuses on channel efficiency and revenue generation.
- ROI accounts for all costs, showing overall profitability.
Platform Nuances: Each advertising platform calculates ROAS slightly differently:
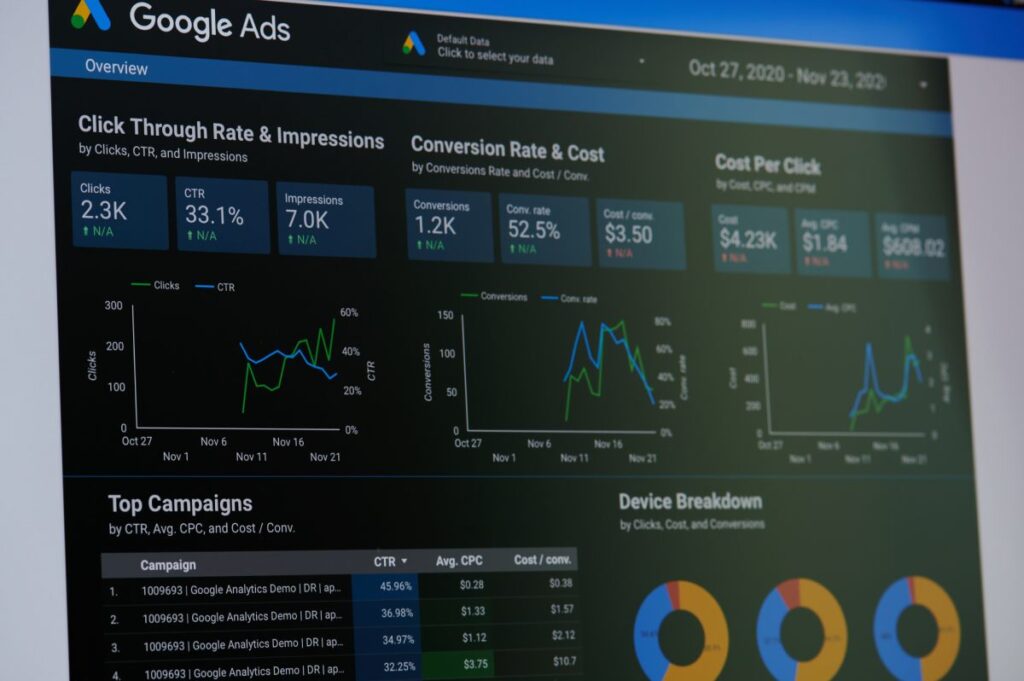
- Google Ads: Measures conversion value per dollar spent.
- Meta Ads: Tracks purchase events via Pixel or Conversions API.
- Amazon Ads: Divides total product sales by total ad spend.
Pro Tip: Always align attribution settings and revenue definitions across platforms to make apples-to-apples comparisons.
Each major advertising platform defines ROAS using the same math but reports it through slightly different lenses. Amazon divides total product sales by total ad spend. Google Ads measures conversion value per dollar spent. Meta Ads calculates the value of purchase events tracked through the pixel or Conversions API.
The principle remains the same across systems, but the underlying data and attribution settings can significantly impact your results.
Building Reliable Inputs for Accurate Calculations
A ROAS calculator is only as reliable as the inputs you provide: ad spend and attributed revenue. Here’s how to ensure both are accurate and consistent across platforms:
- Ad Spend
- Pull directly from each ad platform’s billing or cost column.
- Ensure reporting periods match the scope of your analysis to avoid discrepancies.
- Attributed Revenue
- Revenue inputs are more nuanced because they depend on tracking methods and attribution windows.
- Google Analytics 4: Use total revenue for comprehensive analysis or purchase revenue for ecommerce-only campaigns. Include refunds to maintain accuracy.
- Google Ads: Use conversion value passed via tags or API connections. These values can represent revenue, profit margins, or lead scores.
- Meta Ads: Track purchase events through the pixel or Conversions API.
- Amazon Ads: Attribute product sales based on each campaign’s lookback window.
- Attribution Windows Matter
- Google Ads: Separate click-through, view-through, and engaged-view windows.
- Meta Ads: Defaults to 7-day click / 1-day view.
- Amazon Ads: Typically 7-day lookback.
- Misaligned windows across channels can inflate or deflate ROAS. Consistency is key when comparing results.
Attribution windows determine how much revenue is counted within a period. Google Ads allows separate windows for click-through, view-through, and engaged-view conversions. Meta commonly defaults to a 7-day click or 1-day view window, while Amazon Sponsored Products typically use a 7-day attribution model.
Changing these windows directly affects the revenue portion of your ROAS, so it’s essential to keep them aligned across channels when comparing performance.
Quick Tip: Create a cross-platform tracking checklist to align revenue definitions and attribution periods, ensuring apples-to-apples comparisons for meaningful ROAS insights.
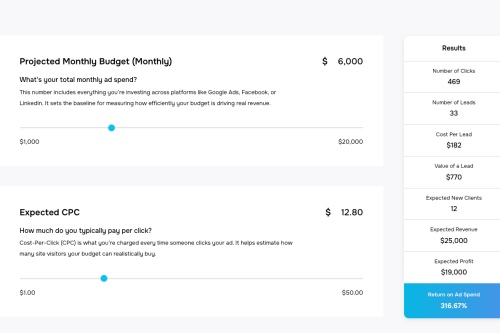
Turning Data Into Actionable ROAS Calculations
Once your inputs are ready, calculating ROAS is straightforward. Define the scope of your analysis, such as “all Search campaigns in Google Ads for the last 30 days with a 7-day click attribution.” Gather total ad spend and attributed revenue for that same scope, divide revenue by spend, then decide how you want to present it. Note: Some platforms, like Amazon, show ROAS as an index (e.g., 4.5), while others convert it to a percent (450%).
Interpreting ROAS requires context. A high ROAS signals that campaigns are generating strong revenue relative to cost, but you’ll need to compare it to your break-even point to see if it’s profitable.
Here is the image converted into a clean, structured table:
| Gross Margin | Break-Even ROAS | Meaning |
|---|---|---|
| 30% | 3.33 | Campaign must generate $3.33 for every $1 spent to break even |
| 40% | 2.5 | Campaign must generate $2.50 for every $1 spent to break even |
| 50% | 2.0 | Campaign must generate $2.00 for every $1 spent to break even |
| 60% | 1.67 | Campaign must generate $1.67 for every $1 spent to break even |
For campaigns exceeding the break-even ROAS, you’re generating gross profit before overhead. Campaigns below the threshold are losing money.
To dig deeper, many advertisers use profit-aware calculations. Google Ads supports passing profit-based conversion values or cost of goods data through Merchant Center, which allows automated bidding toward actual profit.
Platform Factors That Shape Results
Each advertising platform has distinct nuances that influence how ROAS is calculated and optimized.
- Google Ads uses Target ROAS bidding to automatically adjust bids toward maximizing conversion value for each advertising dollar. Setting an initial target slightly below your recent historical average while the system gathers learning data.
- Meta Ads offers ROAS goal setting within value-optimized campaigns, but accurate currency and value parameters are essential for reliable results.
- Amazon Ads uses attributed product sales divided by spend, and reports may restate within the lookback period as final sales data updates. Microsoft Advertising mirrors Google’s tROAS functionality and allows you to set campaign-level targets with optional bid caps.
Several pitfalls can distort your ROAS analysis, such as mismatched attribution windows across channels that can make comparisons meaningless. Missing or incorrect value parameters can skew calculations, especially when currencies or purchase values are passed incorrectly. Refunds might not be deducted consistently across systems.
Conversion modeling and restatements can also shift short-term results as platforms finalize data. Checking how view-through or modeled conversions are included can prevent inflated numbers.
Turning Insight Into Measurable Growth
ROAS is so much more than another performance metric; it’s a lens into how your marketing spend drives revenue and profit. Understanding how to calculate, compare, and act on ROAS helps you build campaigns that perform smarter, scale efficiently, and create sustained value. When your data and strategy work together, your ad spend starts driving results you can measure with confidence.
At 321 Web Marketing, we transform ROAS insights into practical, data-backed actions that strengthen marketing strategy and profitability. Our data-driven approach streamlines digital marketing performance, connecting analytics with real growth.
Contact our team today to schedule a consultation and learn how we can improve your campaigns and return on ad spend, and build a marketing framework that consistently delivers results.
Kim Greer
OFP Law
One of the best business decisions I ever made was to contract with 321 Web Marketing. Jonathan Gessert and his team are knowledgeable, efficient, and effective, making digital marketing goals easy to achieve and helping [...]
Kelly Cole
Business Benefits Group
My company hired 321 Web Marketing in February 2016 to resurrect our web site. We feel our web site is the face to our business and desperately needed a make over. 321 took us from blah to WOW effortlessly and what a difference [...]
Emily Hawkins
Diener & Associates
Thanks to 321 Web Marketing, the client has seen an increase in their search engine leads, averaging 12 qualified leads per month. The client has also achieved prominent Google Maps and search placement. The team manages the engagement [...]
Trevor Telesz
Paw Pals Pet Sitting
321 Web Marketing successfully translated the client’s design into a stunning and refreshed website, ensuring seamless functionality across all dynamic views. The team provided clear timelines and stuck to them, keeping everything [...]
Corey Davis
Spartan Animal & Pest Control
321 Web Marketing is truly phenomenal at what they do. Their ability to communicate and describe the steps and actions that they are implementing , Alex Zarpas in particular, is excellent. Delivering on promises is all they have done for me [...]
Alec Roberts
MFE Insurance
I can’t say it enough, Jonathan and his team have gone above and beyond since day one to accommodate our needs and meet our goals. I run a specialty insurance brokerage based in LA and once we found 321 we never looked [...]
Richard Wilbur III
Advantage.Tech
Thanks to 321 Web Marketing’s web development work, the client increased rankings and traffic from search engines. Also, their business secured prominent positions on Google Maps and industry-relevant, profitable keywords. The client also [...]
Bruce Gemmill
FVCbank
After the website revamp, the client saw a steady rise in leads from search engines, resulting in additional traffic. 321 Web Marketing is highly punctual when it comes to deliverables, and internal stakeholders are impressed with the service [...]
Drew Weeks
VAE
321 Web Marketing delivered a sleek website that accurately portrays the size and quality of the client’s organization. All of their completed websites have received positive feedback from users who have been impressed by the UX/UI. The [...]
Ryan Masten
Masten Pools
321 Web Marketing has increased the client’s leads from zero to 53 monthly. Their SEO efforts pay off impressively due to a top-ranking position on Google and making the site the number one result for several local service keywords. The [...]