
Table of Contents
- 1. Abstract
- 2. Introduction
- 3. How Marketing and Sales Metrics Split Over Time
- 4. Limits of Traffic As a Revenue Indicator
- 5. The Limits of MQLs and Form Fills
- 6. Sales Acceptance As the First Trust Metric
- 7. Intent Data and Buyer Signals That Matter
- 8. Attribution Models and Why Sales Distrust Them
- 9. Aligning Inbound With Sales Stages and Buying Groups
- 10. Measuring Inbound in Pipeline Terms
- 11. What Forward Teams Are Doing Differently
- 12. Conclusion
- 13. FAQs
 Mar 12, 2026 ·
  18 min read ·
  Summarize in ChatGPT
Abstract
Inbound marketing teams measure success by tracking traffic growth, lead volume, and form submissions. Sales teams evaluate success differently. They look at inbound activities that create opportunities for the pipeline, progress through sales stages, and result in closed deals. When marketing and sales departments rely on different measures, disagreements follow, and trust breaks down.
This report explains why common inbound activity metrics do not reliably predict revenue results in B2B organizations, and how teams can redesign inbound systems that do. The analysis draws on research and benchmarks from HubSpot, Salesforce, Gartner, Seer Interactive, and Refine Labs. It focuses on buyer behavior, sales capacity constraints, lead conversion rates, attribution accuracy, and pipeline outcomes.
Organic and paid search traffic no longer provide a reliable signal of demand. Seer Interactive found that click-through rates drop sharply when AI summaries appear in search results, even when brands continue to appear on the page (Seer Interactive, 2025). HubSpot reports that many marketing teams now see unstable or declining search traffic as buyer research habits change (HubSpot, 2026). At the same time, Salesforce reports that sales professionals spend most of their time on administrative work and follow-up tasks rather than active selling, which raises the cost of poor lead quality and reduces tolerance for inbound leads that require requalification (Salesforce, 2026).
Marketing-qualified leads (MQLs) and form submissions also show limited connection to sales acceptance because they often capture early interest without confirming timing, authority, or budget. Refine Labs notes wide gaps between software-based attribution and buyer-reported influence across closed deals, which help explain why sales teams question many inbound performance reports (Refine Labs, n.d.).
The report proposes a framework for inbound design and measurement that starts with sales acceptance and tracks inbound-sourced opportunities that enter the pipeline, move through defined stages, and close within expected timeframes. This approach replaces activity counts with measures sales teams already use to plan capacity, forecast results, and manage deals.
Introduction
Inbound marketing gained traction because it gave teams a way to measure buyer attention before sales contact. Early programs tracked page views, content downloads, and form submissions because these actions were easy to record and compare across campaigns. Over time, many marketing teams began to treat these measures as signs of progress, even though they described activity rather than buying readiness.
Sales teams use a different set of indicators. They focus on opportunities that meet agreed qualification rules, the value of the pipeline tied to those opportunities, average deal size, and how long deals take before they close. These measures connect directly to revenue targets and staffing limits. When inbound reports focus on activity that does not turn into a usable pipeline, sales teams struggle to apply that information to planning or forecasting, and confidence in marketing output declines.
Day-to-day sales constraints make this gap harder to ignore. Sales professionals spend about 40% of their time on direct selling, with the remaining time spent on follow-up, data entry, and internal coordination (Salesforce, 2026). With this setup, sales teams have limited capacity to screen large volumes of inbound leads. Leads that fail basic qualification still require outreach and review, which reduces time available for active opportunities.
Changes in buyer behavior and search results also made traffic a less reliable demand signal. Seer Interactive found that organic click-through rates averaged 0.64% for queries that included AI summaries, compared with 1.41% for similar queries without them (Seer Interactive, 2025). Paid search results followed a similar pattern. Search visibility alone no longer leads reliably to site visits or lead capture.
About 75% of B2B buyers prefer to research independently during the early stages of the buying process (Gartner, n.d.). This places added responsibility on inbound systems to separate early learning activity from buying intent before sales engagement begins. When inbound systems pass this screening task to sales, the cost appears later as longer response cycles and lower follow-through.
This report explains why inbound programs often do not produce a pipeline that sales teams can plan around and describes how teams can design inbound systems that are useful for sales. The analysis focuses on measurement choices, intent signals, qualification rules, and alignment with sales stages so inbound output matches how sales teams plan, prioritize, and close deals.
How Marketing and Sales Metrics Split Over Time
Marketing and sales teams once relied on the same measurement systems. Early customer relationship management tools tracked deals, revenue amounts, and close dates. These measures helped teams understand how work moved through the sales process and how results are tied to revenue goals.
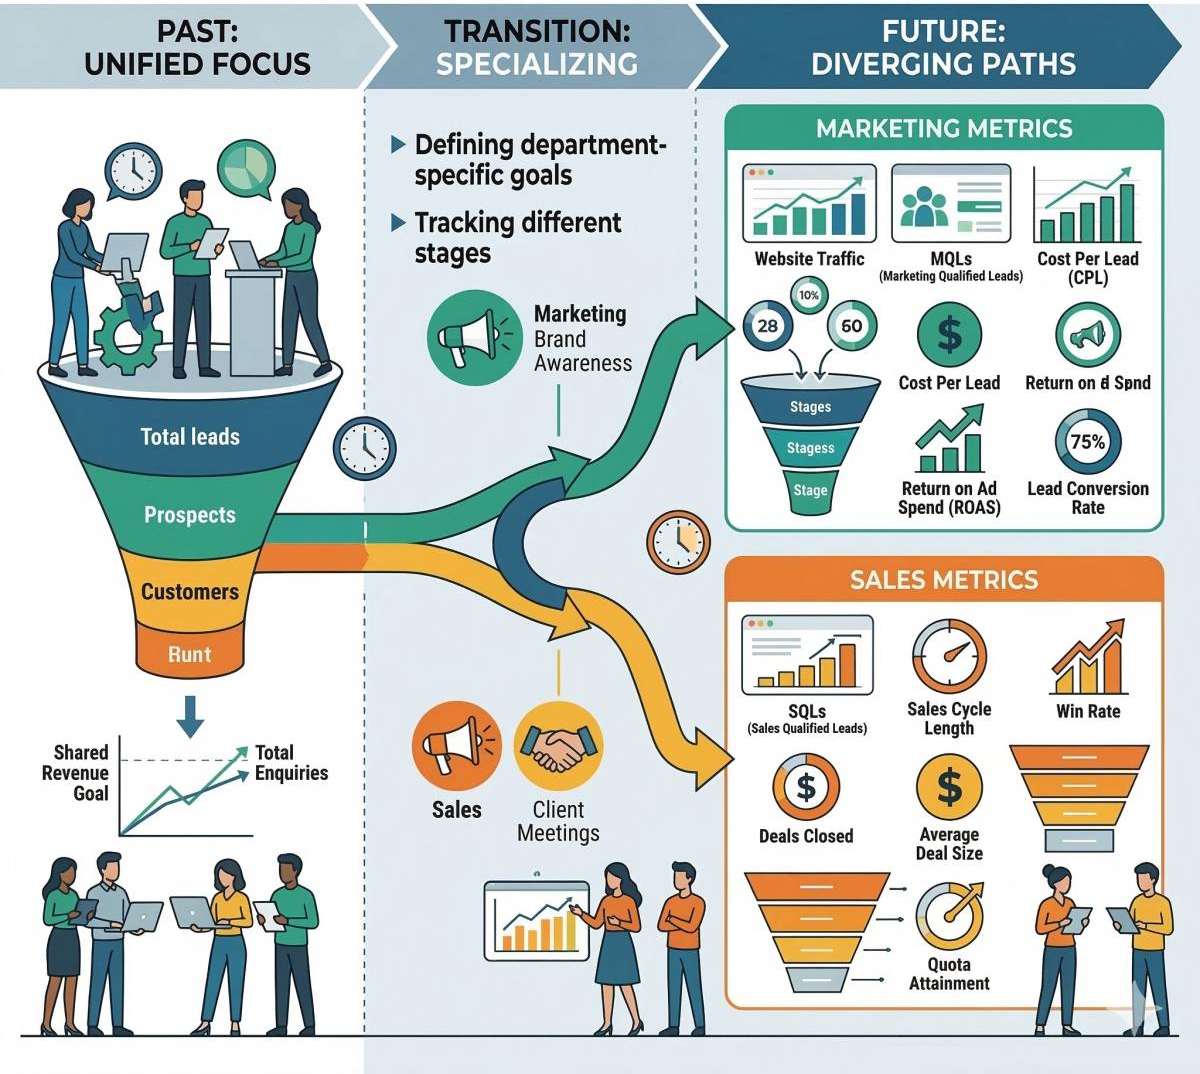
As inbound marketing tools expanded in the mid-2000s, marketing teams gained access to a different set of measures. These tools emphasized volume and reach, such as page views, content downloads, and lead counts. Teams adopted these measures because the tools captured them automatically and allowed easy comparison across campaigns. Over time, many organizations began to treat these activity measures as signs of progress, even though they did not describe movement through the sales process.
| Measurement Category | Common Marketing Metrics | Common Sales Metrics | Primary Purpose | Revenue Reliability |
|---|---|---|---|---|
| Audience Reach | Website traffic, page views, impressions | N/A | Measure visibility and content distribution | Low |
| Engagement | Content downloads, webinar registrations, email opens | N/A | Identify topic interest and early research activity | Low |
| Lead Capture | Form submissions, marketing-qualified leads (MQLs) | Sales-qualified leads (SQLs) | Capture contact information for follow-up | Moderate |
| Sales Validation | N/A | Accepted opportunities | Confirm readiness for sales engagement | High |
| Revenue Pipeline | N/A | Pipeline value, opportunity stage progression | Forecast revenue potential | High |
| Revenue Outcomes | N/A | Closed deals, average deal size, win rate | Measure realized revenue | Very High |
The spread of marketing automation widened the divide. Lead stages such as MQLs became common markers of advancement. These stages relied on scoring rules based on clicks, content use, and form activity. Marketing teams built and managed these rules, often without direct input from sales on outreach readiness. As a result, marketing and sales departments began reviewing different reports that pointed to different outcomes. The marketing unit marked lead volume and stage counts. On the other hand, the sales group tracked opportunities, pipeline value, and deal outcomes.
Salesforce data helps explain why this separation created strain. In its State of Sales research, 57% of sales professionals report that buyers delay purchase decisions more often than in the past (Salesforce, 2026). Longer sales cycles increase the cost of each interaction. Under these conditions, time spent reviewing leads that fail qualification standards reduces time available for active opportunities later in the quarter.
Gartner reports that revenue teams struggle when measurement systems do not align with how buying decisions develop across stages, especially when early engagement metrics stop short of showing downstream progress (Gartner, n.d.). Marketing teams report that, in the end, lead creation does not show whether inbound activity supports opportunity creation, stage advancement, or close rates. Sales teams notice this gap quickly because they are responsible for forecasts and results tied to revenue targets.
This separation comes from different standards for evidence. Marketing reports describe early activity and interest. Sales reports describe outcomes tied to deals and revenue. When these views remain disconnected, teams lack a shared way to judge performance, and confidence between functions weakens.
Limits of Traffic As a Revenue Indicator
Traffic once served as a rough indicator of demand because site visits often led to lead capture. That connection weakened as search platforms changed how they present information. Many search results now answer questions directly on the results page, and paid listings compete with summaries, reducing the need to click through to a website.
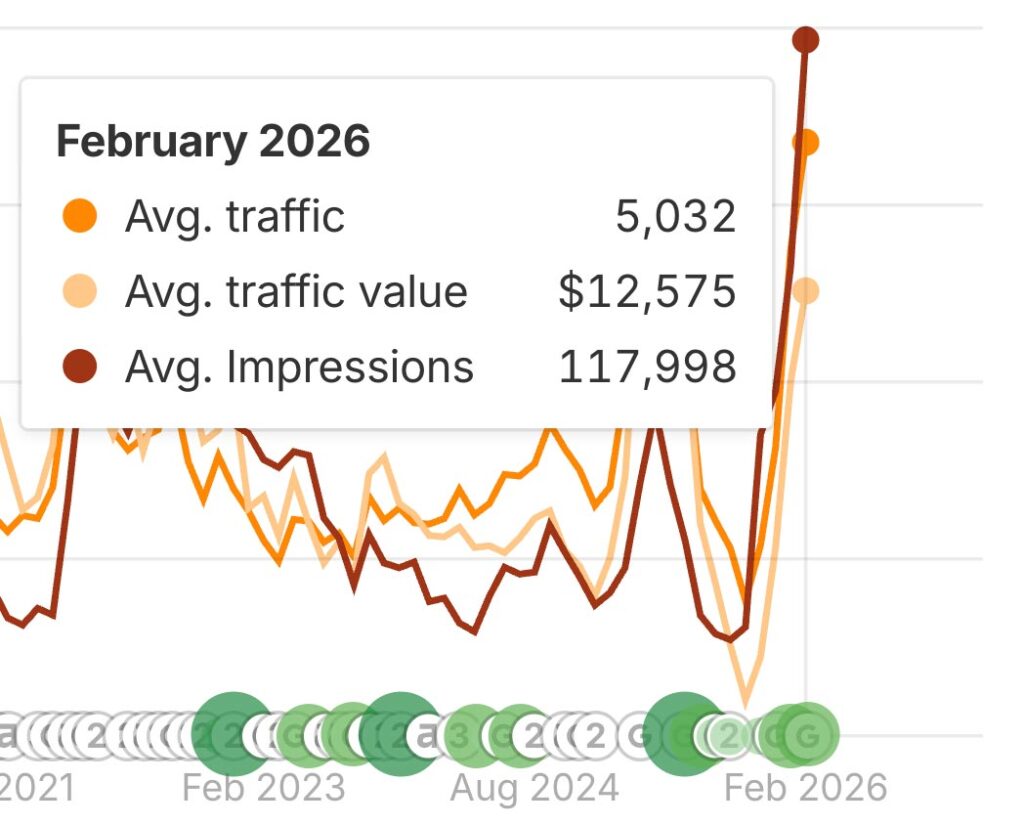
Seer Interactive examined this change by comparing search queries with and without AI summaries. For paid search, the average click-through rate dropped to 9.87% when AI summaries appeared, compared with 21.27% when they did not (Seer Interactive, 2025). This gap shows that visibility and site visits no longer move together. A brand can appear frequently in search results but still capture fewer visits.
HubSpot reports that many marketing teams now see lower or unstable search traffic even as they continue to invest in content production (HubSpot, 2026). This pattern suggests that buyers gather more information before visiting vendor sites or delay visits until later stages of the buying process. As a result, traffic trends provide less insight into active demand than they once did.
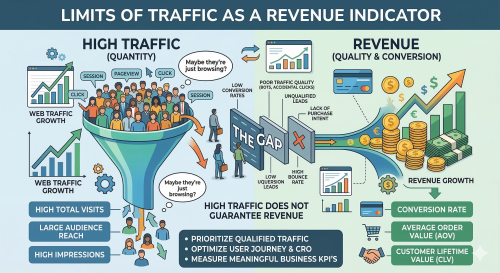
Traffic also provides little information about buying readiness. A site visit does not show budget, authority, or timing. Analytics systems count all sessions the same, even though a visit from a student and a visit from a procurement lead carry different implications. Without signals tied to the intent or evaluation stage, sales teams cannot use traffic data to plan outreach or estimate the pipeline.
When inbound reporting uses traffic as a primary success measure, growth can appear in reports even when pipeline volume and stage movement remain unchanged. This outcome follows directly from how teams define performance. Traffic measures attention, while revenue depends on actions that indicate readiness and reach sales at a point when follow-up makes sense.
The Limits of MQLs and Form Fills
MQLs and form submissions gained wide use because they created a clear handoff between marketing and sales. These measures allowed marketing teams to show how much output their programs produced. They did not, on their own, show readiness for sales outreach.
Only 10–20% of MQLs become sales-qualified leads across most industries (HubSpot, n.d.). In practical terms, this means that 80–90% of leads labeled as qualified by marketing do not meet sales criteria. At scale, this gap creates review and follow-up work that sales teams must absorb alongside quota pressure and limited time.
Form submissions raise similar issues. A form captures contact information, yet it provides little detail about buying readiness. Many forms collect early research activity, such as downloading a guide or registering for a webinar. These actions show topic interest, while purchase timing, budget control, and decision authority remain unknown. When inbound systems treat these actions as signals for sales outreach, sales teams receive contacts that often sit outside active evaluation.
Research from Refine Labs offers a useful comparison. In its demand and pipeline analysis, the firm reports that form submissions tied to declared buying intent convert to qualified opportunities at rates closer to 30–40% when inbound design matches actual buying behavior (Refine Labs, n.d.). The difference between this range and typical MQL-to-SQL conversion rates suggests that qualification rules, rather than channel volume, explain much of the drop-off.
MQLs and form submissions are less useful because they reduce buying behavior to scoring systems built without shared agreement from sales. When lead labels do not align with sales expectations, sales teams rely on their own screening instead. This added review slows response and weakens the advantage that inbound speed is meant to provide.
Sales Acceptance As the First Trust Metric

Sales acceptance (opportunities that enter the pipeline after sales review) marks the point at which inbound output becomes practical for sales use. Acceptance confirms that a lead meets shared rules for outreach and opportunity creation. Because both teams agree to these rules in advance, acceptance provides the marketing and sales teams with a common reference point.
Salesforce reports that buyers now take longer to make decisions and expect clearer justification before moving deals forward (Salesforce, 2026). This environment places tighter limits on sales time. Leads that arrive without a clear scope or timing require extra review and follow-up, which extends sales cycles without improving close rates. In response, sales teams delay or decline inbound leads that do not meet agreed standards.
Research from Refine Labs supports this approach. Inbound success should center on opportunity creation tied to real buying intent (Refine Labs, n.d.). Tracking sales acceptance rates helps teams identify where inbound design falls short. Low acceptance rates point to weak intent screening or routing rules. Higher acceptance rates indicate that inbound output aligns with sales requirements.
Acceptance also clarifies responsibility. Marketing teams commit to passing leads that meet defined criteria. Sales teams commit to working accepted leads within set response windows. This agreement reduces uncertainty around handoffs and narrows attribution discussions, since only accepted opportunities enter pipeline reports.
By limiting handoffs to leads that meet shared standards, sales teams can focus on follow-up. These leads move more quickly because they arrive with clear context and readiness. In this way, acceptance turns inbound from a volume reporting exercise into a reliable source of the pipeline.
Intent Data and Buyer Signals That Matter
Intent data matters because it filters demand before sales contact begins. Different types of activity signal each stage in the buying process. Inbound systems become less reliable when early learning activity and active evaluation are treated alike.
| Signal Type | Examples | Indicates | Sales Readiness |
|---|---|---|---|
| Learning activity | Blog reads, guide downloads, webinar signups | Topic interest | Low |
| Inferred intent | High lead score, repeat visits, email clicks | Behavioral pattern | Medium |
| Declared intent | Demo request, pricing inquiry, stated need | Active evaluation | High |
| Evaluation cluster | Pricing + comparison + demo in short window | Purchase timeline | Very High |
A Gartner study shows that B2B buyers spend much of their time during the decision process stage researching on their own. They usually contact vendors only after they define requirements internally (Gartner, n.d.). This pattern places more responsibility on inbound systems to separate learning activity from buyer readiness. Reading a blog post or downloading a guide often shows interest in a topic. These actions do not show purchase timing or decision authority.
Signals tied to evaluation share common traits. They appear close together in time and focus on product fit or cost. Examples include repeat visits to pricing pages, side-by-side product comparisons, demo requests, or direct statements of intent. These actions show that a buyer has moved beyond research and into evaluation.
There is a clear distinction between inferred intent and declared intent. Inferred intent comes from clicks and scoring rules. Declared intent comes from what buyers state directly when asked why they engaged (Refine Labs, n.d.). Their research shows frequent gaps between software-based scores and buyer-reported intent, which helps explain why sales teams often question inbound leads that rank highly in scoring models.
Intent data improves inbound performance when teams use it to control routing and timing. When inbound systems wait to pass leads until evaluation signals appear, sales acceptance rates improve, and follow-up happens faster. When routing relies mainly on volume targets, sales teams carry more screening work and absorb the risk of misalignment.
Attribution Models and Why Sales Distrust Them
Attribution affects trust because it decides which activities receive credit for revenue. Sales teams rely on attribution reports to understand what influenced deals. When those reports do not match what buyers describe during sales conversations, confidence in the numbers declines.
Most inbound reporting uses first-touch or last-touch attribution. First-touch assigns revenue credit to the earliest recorded interaction. Last-touch assigns credit to the final interaction before conversion. These models simplify reporting and automation, yet they do not represent how B2B deals develop. Buyers often interact with multiple channels over time, and sales teams hear this directly during discovery and evaluation calls.
Refine Labs measured this gap by comparing software-based attribution with buyer-reported influence across 620 declared-intent responses and $21.5M in revenue (Refine Labs, n.d.). The analysis showed that attribution tools captured only part of the sources buyers named as influential. As a result, dashboards often assign credit to channels that buyers do not recall or mention, which reduces confidence in those reports.
Research from Seer Interactive adds further context. As search platforms reduce click volume and increase zero-click exposure, attribution systems capture fewer early demand signals. (Seer Interactive, 2024). A channel can shape buyer awareness or evaluation without producing a site visit, which leaves click-based models with incomplete data.
Sales teams place more weight on attribution when it matches how deals progress in practice. Models that combine system data with buyer-reported input provide a clearer picture because they account for influences that surface during real conversations. When attribution matches buyer experience, teams use it to plan and adjust programs instead of debating results.
Aligning Inbound With Sales Stages and Buying Groups
Inbound systems support revenue when they align with how deals move through sales stages. Sales teams follow defined steps, including discovery, evaluation, approval, and deal closing. Inbound programs need to support these steps by sending leads at points where sales can act without repeating earlier work.
Most B2B purchases involve several stakeholders, often from finance, legal, IT, and operations (Gartner, n.d.). Each group enters the process at a different point and focuses on different concerns. Early-stage content helps buyers define the problem and compare options. Later-stage content addresses cost review, risk review, and internal approval. When inbound systems treat all engagement as equal, they miss these differences and pass leads without stage context.
Longer sales cycles increase review time and slow deal progress, underscoring the need for clear handoffs and usable context (Salesforce, 2026). Inbound handoffs work better when they include details that help sales manage group review. A contact who asks for pricing without internal alignment often pauses later in the process. A contact who shares use case details and approval steps gives sales a clearer path forward.
Inbound alignment depends on two controls. Content and offers need to correspond to specific sales stages. Routing rules need to account for buying group signals alongside individual activity. When inbound systems pass contacts that match stage expectations, sales teams engage.
Clear alignment reduces duplicate effort and shortens the time between first contact and opportunity creation. Sales teams spend less time rechecking readiness and more time advancing deals that already meet agreed standards.
Measuring Inbound in Pipeline Terms
Pipeline-based measurement focuses on outcomes that sales teams already use to run the business. Sales leaders plan capacity, forecasts, and hiring based on the quality and movement of the pipeline, not on lead counts or traffic totals. For inbound to support those decisions, measurement needs to follow the same logic.
| Pipeline Metric | What It Measures | Replaces |
|---|---|---|
| Inbound-sourced pipeline value | Dollar value of opportunities from inbound | Lead volume, traffic counts |
| Sales acceptance rate | % of inbound leads accepted by sales | MQL count |
| Stage progression speed | Days between pipeline stages | Time on site, email open rates |
| Time to close | Days from opportunity creation to closed deal | Cost per lead |
| Closed-won from inbound | Revenue attributed to inbound-sourced deals | Form submission totals |
Salesforce reports that buyers take longer to make decisions and ask for clearer return justification before approval (Salesforce, 2026). Under these conditions, early screening carries more weight. Inbound measurement needs to show whether programs create opportunities that continue moving through later sales stages, rather than stalling after initial contact.
Refine Labs recommends tracking a small set of pipeline measures tied to inbound activity, including inbound-sourced pipeline value, sales acceptance rate, stage progression speed, and time to close (Refine Labs, n.d.). These measures align with the questions sales teams review each quarter:
- How much pipeline inbound created
- How much of that pipeline the sales team accepted
- How quickly opportunities moved through stages
- How many deals closed
Seer Interactive provides further context for this approach. As search platforms reduce click volume and increase zero-click exposure, visibility alone offers less insight into demand (Seer Interactive, 2024). Pipeline measures remain usable even when traffic levels change, because they track outcomes closer to revenue.
Inbound programs that report pipeline results give sales leaders information they can apply directly to planning and review. Programs that stop at activity reporting leave gaps between effort and outcome. The way teams measure inbound performance shapes how useful that work becomes to the revenue process.
What Forward Teams Are Doing Differently
Teams that earn sales trust focus on how inbound output enters the revenue system and how quickly the sales group can act on it. Instead of increasing channel count or content volume, these teams set clear rules for routing, follow-up, and review so inbound demand reaches sales in a usable form.
Salesforce reports that many organizations use automation to manage inbound follow-up with defined rules and faster response times. In one example from the State of Sales (7th ed.), automated agents contacted more than 130,000 inbound leads over four months and created 3,200 opportunities that had received no prior follow-up (Salesforce, 2026). This result shows how consistent screening and timely response can uncover the pipeline that manual processes often miss.
Refine Labs describes a similar pattern among B2B teams that maintain steady pipeline performance. These teams reduce inbound lead volume by removing low-intent conversion offers, raising qualification standards, and sending fewer contacts to sales. With fewer leads entering the system, sales teams spend less time screening and more time following up, which improves acceptance rates and response speed (Refine Labs, n.d.).
Seer Interactive reports that these teams also change how they review channel performance. Instead of relying on traffic levels or cost per lead, they examine which channels contribute to accepted pipeline and later-stage progress (Seer Interactive, 2024). This approach helps teams retain early-stage programs that support deals even when clicks remain limited.
Across these organizations, marketing and sales teams agree on acceptance criteria before leads reach out to sales, measure inbound results through opportunity creation and stage progress, and review performance using shared data. With common rules and shared measures, both teams evaluate inbound output using the same standards. In doing so, the two teams have fewer disagreements and improve their coordination.
Conclusion
Inbound reporting becomes less useful to sales teams when it focuses on activity that does not cover pipeline entry, stage movement, or deal closure. Traffic counts, lead labels, and form submissions describe engagement. Yet, they do not show how deals enter the pipeline, progress through stages, or close. Sales teams judge inbound performance by observable outcomes recorded in their systems, as those outcomes support forecasting, workload planning, and revenue review.
This report explains why the gap between inbound reporting and sales results persists. Buyers do more research before direct contact, which makes traffic less reliable as a signal. Lead scoring systems capture behavior without confirming readiness. Attribution models rely on system events that may not always align with buyer input shared during sales conversations. In each case, sales teams carry the impact through added review time and lower confidence in reported results.
Inbound performance improves when design begins with sales requirements. Teams define clear rules for outreach readiness. Intent signals guide routing and timing. Measurement follows pipeline entry, stage movement, and time to close. These measures match how sales teams review deals, assess risk, and plan capacity.
Rather than adding more tools, this change requires shared definitions, shared reporting, and fewer but clearer handoffs. When inbound systems produce a pipeline that sales can act on, marketing output no longer needs justification. It speaks for itself.
FAQs
Traffic once served as a rough proxy for demand because website visits frequently led to lead capture and sales conversations. That relationship weakened as search behavior changed. Many search platforms now provide answers directly on results pages through AI summaries, reducing the number of clicks to websites even when brands remain visible in search results.
Traffic also fails to indicate buying readiness. Analytics platforms treat all visits equally, even though a student researching a topic and a procurement leader evaluating vendors represent very different levels of intent. Because traffic measures attention rather than purchasing readiness, it rarely provides the information sales teams need to forecast pipeline or plan outreach.
A marketing-qualified lead (MQL) is typically identified through behavioral scoring systems based on actions such as downloading content, opening emails, or completing forms. These signals suggest topic interest but often do not confirm whether the contact is actively evaluating a purchase.
A sales-accepted opportunity, by contrast, represents a lead that meets agreed qualification criteria for outreach and pipeline entry. Sales acceptance usually requires signals such as defined use cases, buying timelines, or authority within a decision process. Because these opportunities meet shared standards, sales teams can engage them immediately and track them through pipeline stages tied to revenue outcomes.
MQLs are typically scored based on behavioral signals like content downloads, email clicks, and page visits. These actions show topic interest but do not confirm purchase timing, budget authority, or decision-making power. HubSpot data shows only 10–20% of MQLs become sales-qualified leads. The gap exists because lead scoring systems are usually built by marketing without direct input from sales on what constitutes outreach readiness. When these labels don’t match sales expectations, reps spend limited selling time reviewing contacts that sit outside active evaluation, which erodes trust in inbound output.
Search platforms increasingly display AI-generated summaries that answer queries directly on the results page, reducing the need for users to click through to websites. Seer Interactive found that organic click-through rates dropped to 0.64% when AI summaries appeared, compared to 1.41% without them. Paid search saw a similar decline, falling from 21.27% to 9.87%. This means a brand can maintain strong search visibility while capturing significantly fewer site visits. As a result, traffic volume no longer reliably indicates active buyer demand, and teams that use traffic as a primary success metric risk reporting growth that doesn’t translate to pipeline.
Sales acceptance is the point at which a sales rep reviews an inbound lead and agrees it meets shared qualification criteria to become a pipeline opportunity. It matters because it represents the first moment inbound output becomes actionable for sales. Unlike lead counts or form submissions, acceptance confirms that both marketing and sales agree the contact is worth pursuing. Tracking acceptance rates reveals whether inbound design is producing leads sales can actually work. Low acceptance rates signal weak intent screening or misaligned routing rules, while higher rates indicate that inbound output matches what sales needs to plan capacity and forecast results.
Resources
- Gartner, Inc. (n.d.). The B2B buying journey: How top CSOs and CMOs optimize revenue growth.https://www.gartner.com/en/sales/insights/b2b-buying-journey
- HubSpot. (2026). Marketing statistics: The latest data, trends, and insights.https://www.hubspot.com/marketing-statistics
- Refine Labs. (n.d.). Optimizing pipeline in the do more with less era.https://www.refinelabs.com/article/optimize-pipeline-do-more-with-less-era
- Refine Labs. (n.d.). A hybrid attribution framework: Bridging software data and buyer-reported influence.https://www.refinelabs.com/article/hybrid-attribution-framework
- Salesforce. (2026). State of sales (7th ed.).https://www.salesforce.com/resources/research-reports/state-of-sales/
- Salesforce. (2026). State of sales report announcement.https://www.salesforce.com/news/stories/state-of-sales-report-announcement-2026/
- Seer Interactive. (2024). Why 2020s SEO KPIs won’t work in 2024 in a GenAI, data-scarce world.https://www.seerinteractive.com/insights/why-2020s-seo-kpis-wont-work-in-2024-in-a-genai-data-scarce-world/
- Seer Interactive. (2025). Google AI Overviews study: Organic and paid CTR impact.https://www.seerinteractive.com/insights/ctr-aio/
Kim Greer
OFP Law
One of the best business decisions I ever made was to contract with 321 Web Marketing. Jonathan Gessert and his team are knowledgeable, efficient, and effective, making digital marketing goals easy to achieve and helping [...]
Kelly Cole
Business Benefits Group
My company hired 321 Web Marketing in February 2016 to resurrect our web site. We feel our web site is the face to our business and desperately needed a make over. 321 took us from blah to WOW effortlessly and what a difference [...]
Emily Hawkins
Diener & Associates
Thanks to 321 Web Marketing, the client has seen an increase in their search engine leads, averaging 12 qualified leads per month. The client has also achieved prominent Google Maps and search placement. The team manages the engagement [...]
Trevor Telesz
Paw Pals Pet Sitting
321 Web Marketing successfully translated the client’s design into a stunning and refreshed website, ensuring seamless functionality across all dynamic views. The team provided clear timelines and stuck to them, keeping everything [...]
Corey Davis
Spartan Animal & Pest Control
321 Web Marketing is truly phenomenal at what they do. Their ability to communicate and describe the steps and actions that they are implementing , Alex Zarpas in particular, is excellent. Delivering on promises is all they have done for me [...]
Alec Roberts
MFE Insurance
I can’t say it enough, Jonathan and his team have gone above and beyond since day one to accommodate our needs and meet our goals. I run a specialty insurance brokerage based in LA and once we found 321 we never looked [...]
Richard Wilbur III
Advantage.Tech
Thanks to 321 Web Marketing’s web development work, the client increased rankings and traffic from search engines. Also, their business secured prominent positions on Google Maps and industry-relevant, profitable keywords. The client also [...]
Bruce Gemmill
FVCbank
After the website revamp, the client saw a steady rise in leads from search engines, resulting in additional traffic. 321 Web Marketing is highly punctual when it comes to deliverables, and internal stakeholders are impressed with the service [...]
Drew Weeks
VAE
321 Web Marketing delivered a sleek website that accurately portrays the size and quality of the client’s organization. All of their completed websites have received positive feedback from users who have been impressed by the UX/UI. The [...]
Ryan Masten
Masten Pools
321 Web Marketing has increased the client’s leads from zero to 53 monthly. Their SEO efforts pay off impressively due to a top-ranking position on Google and making the site the number one result for several local service keywords. The [...]