


Table of Contents
- 1. Introduction
- 2. The honest state of inbound in 2026
- 3. The six failure modes that kill most inbound programs
- 4. The attribution problem most teams miss
- 5. The rebuild framework: Inbound that actually drives revenue
- 6. The benchmarks that tell you whether it’s working
- 7. Match the fix to the real inbound problem
- 8. Frequently Asks Questions

 Jul 6, 2026 ·
  26 min read ·
  Summarize in ChatGPT
Introduction
A marketing leader is reviewing the quarter-end dashboard two weeks before a board meeting. Most metrics seem to be doing well: organic traffic looks solid, gated offers continue to bring in form fills, and the marketing-qualified lead (MQL) count is a decent number.
However, inbound-sourced revenue is trailing. Sales reps distrust the leads because too few contacts progress to qualified sales conversations. As the board meeting approaches, the marketing lead needs a direct answer to this question: Why does the inbound program produce activity, but not enough revenue?
An inbound marketing program stops working not because inbound itself has no value. It underperforms when one or more parts of the revenue path do not support sales. The problem might sit in the content plan, the offer, the distribution plan, the sales handoff, or the attribution model. Fixing inbound starts with finding the point where buyer interest stops turning into qualified pipeline.
For example, content marketers might prioritize high-volume keywords that bring in broad traffic but little buying intent. Marketing leaders might use broad e-books or webinars that collect email addresses without showing whether the person has a real need, budget, or buying timeline. Content managers might publish useful assets without a plan for getting those assets into sales conversations, email programs, LinkedIn posts, partner channels, or buyer communities.
The sales handoff creates another problem when marketing and sales define quality differently. The marketing team reports MQL volume, while sales reps receive contacts that do not align with the company’s offer, deal size, or sales process. Attribution then adds another gap when reports credit only the final tracked source and miss earlier content that helped the buyer move toward a sales conversation.
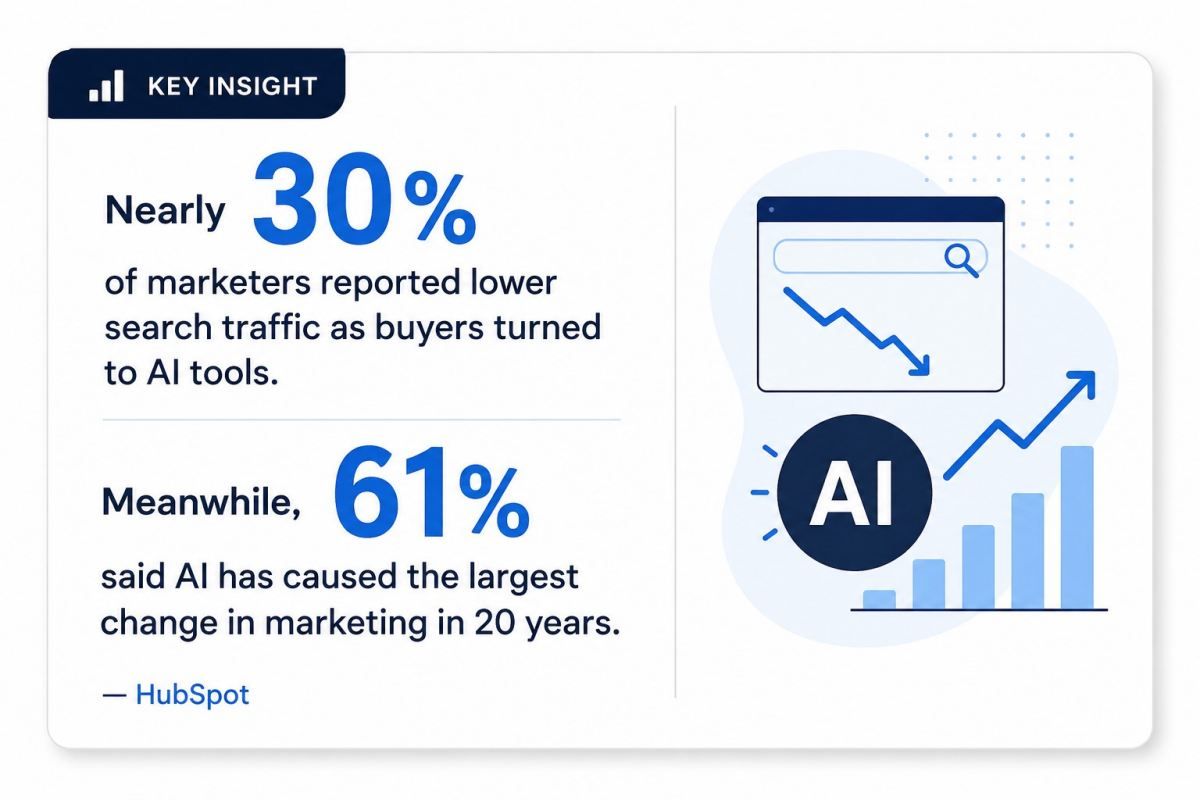
Artificial intelligence (AI) has made the issue harder to measure. Buyers now use AI tools during research, so search traffic no longer gives marketing leaders a complete view of demand. If a company leader treats traffic as the main proof of inbound value, the report misses harder-to-see signals, including buyer trust, lead fit, sales acceptance, pipeline, and closed revenue.
That is why inbound marketing return on investment (ROI) should be judged by pipeline and closed revenue. A program with steady traffic still underperforms when it sends poor-fit leads to the sales team. The traffic numbers hide the real issue: the program attracts visitors but not enough buyers who align with the company’s offer and sales process.
The same issue appears when companies move upmarket. Strategies that work in the $10,000 to $50,000 annual contract value range break down above $100,000, where buyers who submit forms or ask for demos decline and the pipeline slows (Olennikova, 2026). That pattern explains why teams search for “inbound marketing not working” after years of content, search engine optimization (SEO), gated assets, nurture emails, and marketing software.
This article explains why inbound marketing fails and how to fix it through a revenue-based operating model. It covers the current state of inbound, the six failure modes, the attribution problem most teams miss, the rebuild framework, and the benchmarks that show whether the fix works. The goal is to build inbound marketing that drives revenue by tying content, offers, sales handoffs, and measurement to the pipeline.
The honest state of inbound in 2026
In 2026, buyers do not move through inbound in a straight line. They search, compare vendors, read reviews, ask peers, use AI tools, and verify sales claims before talking to a sales rep. The problem starts when an inbound marketing strategy is still treated as a simple path from blog post, to form fill, to nurture email, to MQL, to sales.
That model gives too much credit to tracked clicks and form fills while giving too little credit to the research buyers conduct before they reach the company’s website. For example, a buyer might first find an answer through AI search, read a LinkedIn post, hear a podcast mention, or ask a peer for their opinion. By the time that buyer visits the vendor’s site, the tracking report sees the visit but misses much of the research that shaped it.
What’s actually changed
AI search has changed the first stage of the buyer research. AI search has changed how 79% of software buyers conduct research. About 3 in 10 are more productive with AI search than with traditional search, or start research with AI search more than with Google (G2, 2025). This creates a problem for any inbound marketing strategy built around broad top-of-funnel posts. Basic ranking visibility means less when buyers can get simple definitions from AI tools before they visit a company website.
Content now needs to answer the questions AI search cannot settle for the buyer. Basic “what is” content has less value when AI tools already answer the simple question. Stronger content gives proof, use cases, cost context, buyer risks, and clear next steps. That helps buyers decide whether a solution fits their company, budget, and sales process.
Buyers also consult more third-party sources before they reach a vendor website. In business-to-business (B2B) buying, Reddit threads, LinkedIn posts, G2 reviews, peer groups, Slack groups, and podcasts now sit beside search and vendor pages. By the time a buyer fills out a form, that buyer has likely compared claims, checked outside opinions, and looked for proof the vendor does not fully control.
Demand Gen Report’s 2024 B2B Buyer’s Survey supports that pattern. It found that 41% of buyers added more detailed ROI analysis, 34% spent more time on research, and 33% relied more on peer tips and reviews (Lindenau, 2024). These facts also clarify inbound vs outbound marketing and demand generation vs inbound. Outbound starts contact before the buyer asks for help. Demand generation builds trust before the hand raise. Inbound gives the buyer a clear next step when intent becomes visible.
| Approach | How It Starts | What It Does |
|---|---|---|
| Outbound | Starts contact before the buyer asks for help | Reaches buyers who have not raised their hand |
| Demand generation | Works before the buyer asks for help | Builds trust and awareness ahead of the hand raise |
| Inbound | Engages once intent becomes visible | Gives the researching buyer a clear next step |
What hasn’t changed
Buyers still do research before making a purchase. They compare vendors, check outside opinions, and test whether the company understands their problem. Inbound marketing works when the content answers the questions a serious buyer asks before calling a sales rep.
Each content type should answer the questions buyers ask at that point in the decision. Early-stage content explains the problem and defines the terms buyers need to understand. Mid-stage content compares options, explains tradeoffs, and helps the buyer justify the purchase internally. Late-stage content shows whether the solution fits the buyer’s use case, budget, risk concerns, and next sales step.
6sense reports that first contact with sellers moved from 69% of the buying path in 2024 to 61% in 2025, while 95% of winning vendors were already on the Day One shortlist (6sense, 2025). By the time many buyers speak with a sales rep, they have already removed several vendors from the list. Inbound content needs to reach those buyers before the first sales conversation.
This also changes how marketing teams should read B2B inbound benchmarks. Traffic and MQL volume show activity, but they do not show whether target accounts trust the company, request a sales conversation, or move into the pipeline. Stronger measurement tracks whether the lead fits the target account, whether sales accepts the lead, which content buyers mention, pipeline value, and closed revenue.
Inbound vs outbound marketing separates two different ways of reaching buyers. Outbound starts contact before the buyer asks for help. Inbound supports buyers who are already researching a problem, option, or solution. Both work better when sales and marketing teams track the same accounts, pipeline, and revenue outcomes.
Why “inbound is dead” misses the real issue
Marketing teams that say inbound is dead often describe a poor version of inbound. The program depends on broad blog posts, low-intent gated assets, and limited distribution and MQL volume. Marketing publishes content, collects form submissions, and treats those form submissions as demand. The HubSpot inbound results may show traffic, conversions, and MQLs, but sales still receives leads that do not match the company’s offer, deal size, or buying process.
The problem starts with how marketing builds and measures the program. Keyword research shows what people search for, but it does not replace buyer research. Gated assets collect contact details, but they should also show whether the person has a real buying need. Distribution should place content where buyers compare vendors, ask peers for input, and test sales claims.
Inbound works when marketing matches content, offers, handoffs, and reporting to how buyers make decisions. Content should answer real buyer questions. Offers should show intent. Sales handoffs should give reps enough context to respond quickly and usefully. Reports should connect content, form fills, accepted leads, pipeline, and closed revenue.
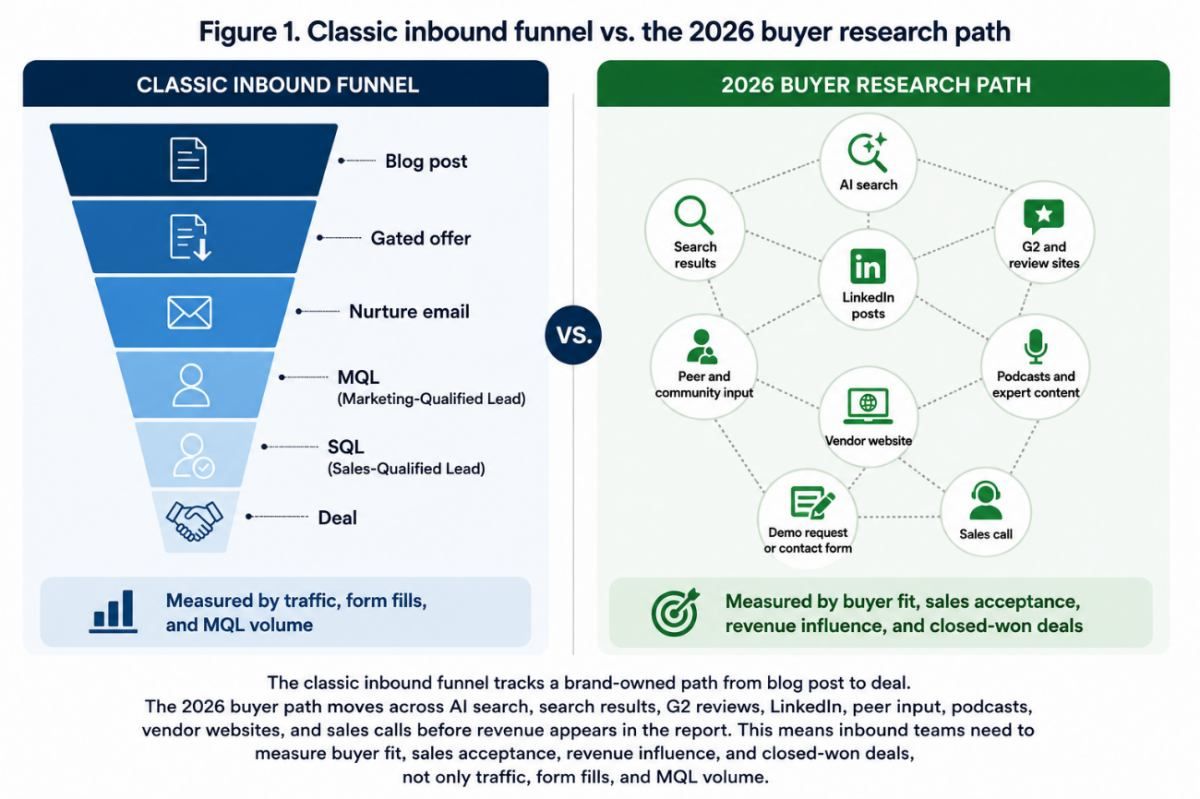
Figure 1. Classic inbound funnel vs. the 2026 buyer research path
The six failure modes that kill most inbound programs
Inbound loses revenue in specific places: the content attracts the wrong audience, the offer collects weak intent, distribution misses the buyer’s research channels, sales rejects the leads, or attribution misses the content that helped the deal. Marketing teams should find the cause before adjusting their budget, publishing more content, or launching another campaign.
A program can show strong traffic, steady form fills, and a high MQL count while inbound-sourced revenue does not grow. This happens when marketing creates contacts, but too few of those contacts have the need, account fit, budget, or urgency required for a sales conversation.
Lead benchmarks show why the first conversion number is not enough. The average lead-to-MQL conversion rate is 31% across all industries, channels, and page types, but that number only shows how many leads meet marketing’s threshold. The same funnel also tracks later stages, including MQL to sales-qualified lead (SQL), SQL to opportunity, and opportunity to closed customer (Bailyn, 2025).
The latter stages show whether inbound creates sales value. A lead has little revenue value if sales rejects it, if it never becomes an opportunity, or if it never closes. The average MQL-to-SQL conversion rate is 13% across industries, 18% to 22% for B2B SaaS, and 25% to 35% for top performers (Manchanda, 2026). If MQL volume rises while SQLs, opportunities, and closed revenue stay low, the inbound problem is lead quality, not lead volume.
Failure mode 1: Content built for keywords, not for buyers
This problem starts when content marketers choose topics mainly by search volume. They find high-volume keywords, write posts around those terms, and bring in visitors who have little connection to the company’s market, deal size, or sales process. Traffic increases, but the visitors do not match the buyers sales needs.
The issue shows up in both page data and sales data. High-traffic pages bring in visitors, but those visits do not turn into qualified demos, sales calls, or pipeline. The content answers a broad search query, but it does not help buyers compare vendors, justify a purchase, assess risk, or decide what to do next.
That is why content marketing not converting is not only a writing problem. The page might answer a common question, but the question may not come from a serious buyer. A buyer looking for cost details, proof, risk information, or use-case fit will not act on a broad post that only explains the topic.
The fix starts with buyer questions. Keyword data should support the content plan, not control it. Content should follow the decisions buyers need to make: define the problem, understand the cost of inaction, compare options, weigh tradeoffs, review proof, and choose the next sales step.
Failure mode 2: Weak or wrong offers
The second problem occurs when the offer collects an email address but does not show buying intent. Generic e-books, broad white papers, and general webinars ask for little more than curiosity. A person might download them to learn the topic, but the download does not prove need, budget, urgency, or fit.
Marketing creates poor-fit leads when it asks visitors for contact details before the content gives them useful value (Davidoff, 2014). The form sends a name to sales, but that person has not shown a clear reason to speak with a rep.
The warning sign is high MQL volume with a low MQL-to-SQL conversion rate. The marketing team sees form fills and counts them as demand. The sales group receives contacts that do not match the company’s target account, buying problem, or timeline. This lowers inbound lead quality because the offer did not separate active buyers from general readers.
The fix is to replace broad-gated assets with offers tied closely to the product and the buyer’s work problem. These include assessments, tools, calculators, use-based checklists, and benchmark reports. A serious prospect uses them to test whether the product fits their use case, compare options, estimate cost or risk, or prepare for a sales conversation.
Failure mode 3: No real distribution strategy
The third problem begins after content goes live. Some marketing teams publish the asset, send one email, post it on LinkedIn, and wait for SEO to bring in traffic. That leaves too much of the content’s reach to chance. Buyers will not see the asset unless marketing places it in the channels where they research problems, compare vendors, and ask peers for advice.
The warning sign is a content library that looks useful but receives little attention outside the company’s website. Organic traffic stays low or declines. Few third-party sites, peer communities, or social posts mention the content. Sales reps also leave the asset out of sales conversations because marketing did not explain when to use it, which buyer question it answers, or which stage of the deal it supports.
The marketing team should plan distribution before the asset goes live. The plan should name the owned channels that will carry the asset, the sales conversations where reps should use it, and the partner or earned channels that fit the topic. It should also identify the buyer groups that need to see the content.
This is also why inbound marketing mistakes build on each other. Keyword-first content brings in low-fit traffic. Broad gated assets collect low-intent contacts. Poor distribution keeps useful content away from buyers who are already researching the problem.
Failure mode 4: The MQL trap
The MQL trap arises when marketing treats lead volume as the main proof of inbound success. That goal pushes marketing teams to add more forms, use broader offers, and lower the standard for MQL status. The report looks better, but sales receives more contacts that lack the need, account fit, timing, or budget for a qualified sales conversation.
The warning sign is strong MQL volume with weak sales results. MQL counts rise, but SQLs, opportunities, and closed-won deals stay low. Sales questions inbound lead quality, while marketing creates more leads instead of fixing the offer, targeting, or qualification rules.
A low MQL-to-SQL conversion rate shows that many leads meet marketing’s threshold but do not meet sales standards. The average rate is 13% across industries, which means 87 out of 100 MQLs do not become SQLs under that benchmark view (Manchanda, 2026). When leaders review only MQL volume, they cannot see how many leads sales accepts, how many become opportunities, or how many produce closed revenue.
Marketing should use pipeline and closed-won revenue as the main success measures. MQLs still work as an early signal, but they should not set the direction of the program. A stricter qualification standard should reduce low-fit leads and send sales more contacts with a clear buying problem, account fit, and reason to speak with a rep.
Failure mode 5: Misalignment with sales
The fifth problem starts when marketing and sales use different standards for the same lead. Marketing counts a contact as an MQL when the person fills out a form or reaches a score threshold. Sales gives priority to contacts with a clear buying problem, account fit, timing, and budget. When both teams use different qualification rules, marketing sees demand while sales sees poor-fit contacts.
The warning sign appears in follow-up and feedback. Sales reps respond late, skip some inbound leads, or give short notes such as “bad lead.” Marketing sees the missed follow-up and treats it as lost demand. The deeper problem is that marketing and sales have not agreed on what makes a lead sales-ready, how quickly sales should respond, and what lead-quality feedback sales should send back.
Marketing and sales should define the handoff in a service-level agreement (SLA). The SLA should state what makes a lead sales-ready, how quickly sales responds, which fields sales needs, and how reps report inbound lead quality. A weekly review should check accepted leads, active opportunities, stalled deals, and closed revenue from inbound.
Both teams should share responsibility for the pipeline. The marketing unit should see what happens after the handoff. The sales team should see which content, offer, and source shaped the buyer’s request. The dashboard should track accepted inbound leads, pipeline value, and closed revenue.
Failure mode 6: Broken attribution hiding real wins
The sixth problem appears when inbound influences a deal, but the report credits only the final tracked source. A buyer might read a blog post, hear a podcast, check LinkedIn, ask a peer, and later book a demo through direct traffic or branded search. The attribution report credits the final visit, while the earlier research receives no credit.
The warning sign is a mismatch between buyer comments and dashboard data. Sales hears prospects mention content, reviews, podcasts, or LinkedIn posts. HubSpot or Salesforce credits direct traffic, branded search, paid search, or the final form source because the report records the last tracked action.
This affects budget decisions. Marketing leaders might cut content that influenced buyers because the dashboard gives credit to another source. 321 Web Marketing estimates that tracked attribution under-reports inbound influence by 30% to 50% when buyers engage with content or peer sources before a tracked conversion. Marketing leaders should compare that range against self-reported attribution, content engagement, pipeline value, and closed-won revenue.*
The fix is to add self-reported attribution to tracked attribution. Demo forms should ask how the buyer heard about the company in the buyer’s own words. Sales reps should record which content and sources buyers mention during calls. Marketing should then compare tracked source, self-reported source, content touchpoints, pipeline, and closed revenue.
This gives leaders a clear view of inbound pipeline attribution because they can compare the source the software recorded with the content, peer sources, and sales conversations the buyer named. Revenue teams should use tracked data to compare channels and self-reported data to record what buyers remember.
The attribution problem most teams miss
Attribution loses accuracy when the report tracks only clicks, form fills, and the last known source before a demo. Buyers might ask peers, hear a podcast, read a LinkedIn post, check reviews, or use an AI answer before the tracking system records anything.
The report then credits the visible step and leaves earlier research out of the record. This affects inbound marketing ROI because executive leaders base budget decisions on the sources that receive credit. If the report credits direct traffic, paid search, or a branded form fill, marketing may miss the content, podcast, peer source, or social post that helped the buyer reach a sales conversation.
Why tracked attribution under-reports inbound
Tracked attribution works best when buyers follow clear digital steps. A buyer clicks a link, fills out a form, and the system records the source. This model becomes less accurate when buyers research in private channels before they click anything the company owns.
Those private channels include Slack groups, peer conversations, podcasts, LinkedIn posts, AI chat answers, and review sites. In those places, the buyer forms an opinion about the company before the tracking system sees the buyer. Later, the buyer may visit the site through direct traffic, branded search, or another tracked source.
Software-based attribution and first-party customer-led attribution showed a 90% gap for dark social channels in a study using 620 declared-intent conversions, attribution data, and $21.5 million in closed-won annual recurring revenue (Refine Labs, 2023). The study shows why software attribution misses buyer activity that happens before a tracked click, especially in peer conversations, podcasts, LinkedIn posts, AI chat answers, and review sites.
Podcast data shows the same problem in revenue terms. Podcasts received 53% of revenue credit through self-reported attribution, equal to $11.4 million in closed-won revenue. Software attribution credited podcasts with 0% (Refine Labs, 2023).
That is why HubSpot inbound results and Salesforce reports need close review. They show tracked steps, but do not show every source the buyer used, trusted, or named during the buying process.
| Dimension | Tracked (Software) Attribution | Self-Reported Attribution |
|---|---|---|
| What it records | Clicks, form fills, and the last known source before a demo | The buyer’s own answer to “How did you hear about us?” |
| Captures well | Clear digital steps on owned properties | Dark social: podcasts, peer referrals, communities, LinkedIn, AI answers |
| Blind spots | Research in private channels before a tracked click | Campaign-level detail (which episode or post converted) |
| Refine Labs finding on podcasts | 0% of revenue credited | 53% of revenue credited ($11.4M closed-won) |
| Best use | Compare pages, offers, campaigns, and forms | Record which sources buyers actually name |
What accurate attribution actually looks like
Accurate attribution starts by asking buyers where they first heard about the company. Demo forms should ask, “How did you hear about us?” Sales reps should ask the same question on the first call. The marketing team should record the buyer’s answer before placing it into a channel category.
Self-reported attribution gives sales and marketing a shared record of what buyers remember. If buyers cite a podcast, LinkedIn post, peer recommendation, or guide, marketing can see patterns that tracked reports miss. This helps marketing leaders, sales leaders, and top executives see which sources buyers named before the first tracked visit.
More than 8,500 self-reported attribution answers from 36 B2B software-as-a-service (SaaS) companies showed that more than 80% of first-touch and last-touch results fell into organic, direct, or pay-per-click (PPC) (Atli, 2025). First-touch and last-touch reports group many buying paths under broad channel labels, which hides the sources buyers named in their own words.
Accurate inbound marketing measurement also needs content data tied to target accounts. The marketing team should track which target accounts viewed buyer-stage content, used product-linked offers, returned to the site, and later entered the pipeline. Those signals connect content to revenue without forcing one click to explain the full deal.
Branded search also helps show demand that started before the website visit. A buyer who searches for the company name already knows the brand. That signal is stronger when marketing compares it with self-reported source data and pipeline data from accounts that engaged with content.
How to build reporting that leadership will trust
Marketing should use dual-track reporting. Tracked attribution should stay in the dashboard because it helps compare pages, offers, campaigns, and forms. Self-reported and influence-based attribution should sit beside it because those views show what buyers remember and which sources they used before speaking with sales.
This gives the CEO and CFO a clear way to judge inbound marketing spend. The first view shows which tracked paths were converted. The second view shows which sources buyers named, which accounts engaged with content, and which deals reached the pipeline after that engagement.
This also changes how to fix inbound marketing when the program looks weak. If tracked reports give content little credit, but buyers cite content in forms and sales calls, the company has a measurement problem. If tracked reports and buyer-reported sources both show weak results, the company has a content, offer, or distribution problem.
A useful dashboard should show tracked source, self-reported source, content engagement, account stage, pipeline value, and closed-won revenue. That view lets leaders compare the source the software recorded with the content, peer sources, and sales conversations the buyer named.
The rebuild framework: Inbound that actually drives revenue
The marketing team fixes inbound by working in a set order: revenue goal, content plan, offers, distribution, sales handoff, and measurement. This order keeps marketing leaders from buying tools or publishing more content before they know which stage loses sales-ready leads, such as the offer, the handoff, or the attribution report.
Executive teams intend to use marketing reports to answer what works, what to cut, and where to invest, which puts more pressure on revenue-linked attribution (CaliberMind, 2025).
Step 1: Reset the goal
Marketing should stop treating MQLs as the main goal. MQLs still work as an early signal, but they do not prove that inbound creates sales value.
The program should measure the pipeline created and revenue influenced by closed-won deals. Marketing and sales leaders should set a 12-month pipeline target before updating the content plan. That target should guide how many sales-ready leads the program needs, which offers to build, and which channels to use.
This defines inbound marketing ROI by pipeline created and closed-won revenue influenced.
Step 2: Rebuild the content plan around buyer decisions
An inbound marketing strategy should attract the right prospects through content that solves real problems. It should also guide buyers through attraction, engagement, conversion, and loyalty (Kazinik, 2025).
The content plan needs four tiers:
- Unaware content explains the category.
- Aware content defines the problem.
- Consideration content compares options.
- Decision content gives proof, sales context, and the next step.
| Content Tier | What It Does | What the Buyer Is Deciding |
|---|---|---|
| Unaware | Explains the category | They do not yet know the category exists |
| Aware | Defines the problem | Whether the problem applies to them |
| Consideration | Compares options and tradeoffs | Which option to shortlist and how to justify it internally |
| Decision | Provides proof, sales context, and the next step | Whether the solution fits their use case, budget, and risk |
Weak inbound programs spend too much time on unaware and aware content. Those pages create reach, but they do not answer the questions buyers ask when comparing vendors or preparing to speak with a sales rep. The marketing team should add more consideration and decision content before publishing broader posts.
Step 3: Replace weak offers
The offer should show intent. A generic e-book download shows interest in the topic, but it does not prove buying need, urgency, or fit.
Offers tied closely to the product and the buyer’s work problem work better as intent filters. Examples include assessments, calculators, benchmark reports, and product-linked tools. These offers ask buyers to share a real problem, compare options, or test fit before speaking with sales.
This also clarifies demand generation vs inbound. Demand generation builds trust before the buyer asks for help. Inbound gives the buyer a clear next step when the need becomes active.
Step 4: Build distribution before publishing
Content does not help the pipeline if target buyers never see it. Marketing should write the distribution plan before the asset goes live. The plan should name the owned channels, sales conversations, partner channels, and earned placements that fit the topic. It should also identify the buyer groups that need to see the content.
Owned email, LinkedIn, community channels, earned placements, sales follow-up, and paid support should each have a defined use. Reddit, Slack groups, and niche forums matter when buyers use them to ask peers for input. Marketing should choose channels based on buyer research habits.
Step 5: Fix the sales handoff
Marketing and sales should use the created pipeline, accepted leads, active opportunities, and closed-won revenue as shared success measures. The handoff should include the content, offer, and source that shaped the buyer’s request.
The SLA should define what makes a lead sales-ready, how quickly sales responds, which fields sales needs, and how reps send lead-quality notes back to marketing. A weekly review should cover accepted leads, active deals, stalled deals, and closed revenue from inbound.
This step is central to how to fix inbound marketing because marketing sees form fills, while sales sees fit and timing. The handoff should show why the buyer filled out the form and what sales needs to do next.
Step 6: Rebuild measurement with dual-track attribution
In the final step, marketing should measure inbound through tracked attribution and self-reported attribution. Tracked attribution helps compare pages, campaigns, forms, and offers. Self-reported and influence-based attribution show which sources buyers named and which content reached accounts that later entered the pipeline.
This gives company leaders the measurement base needed to build inbound marketing that drives revenue. The dashboard should show which content and offers influenced each accepted lead. It should also show the source data, pipeline value, and closed-won revenue tied to those leads.
When reporting connects marketing and sales work to revenue, budget decisions become easier to defend. Company leaders can compare which content and offers influenced accepted leads, which sources buyers named, and which work contributed to pipeline and closed-won revenue.
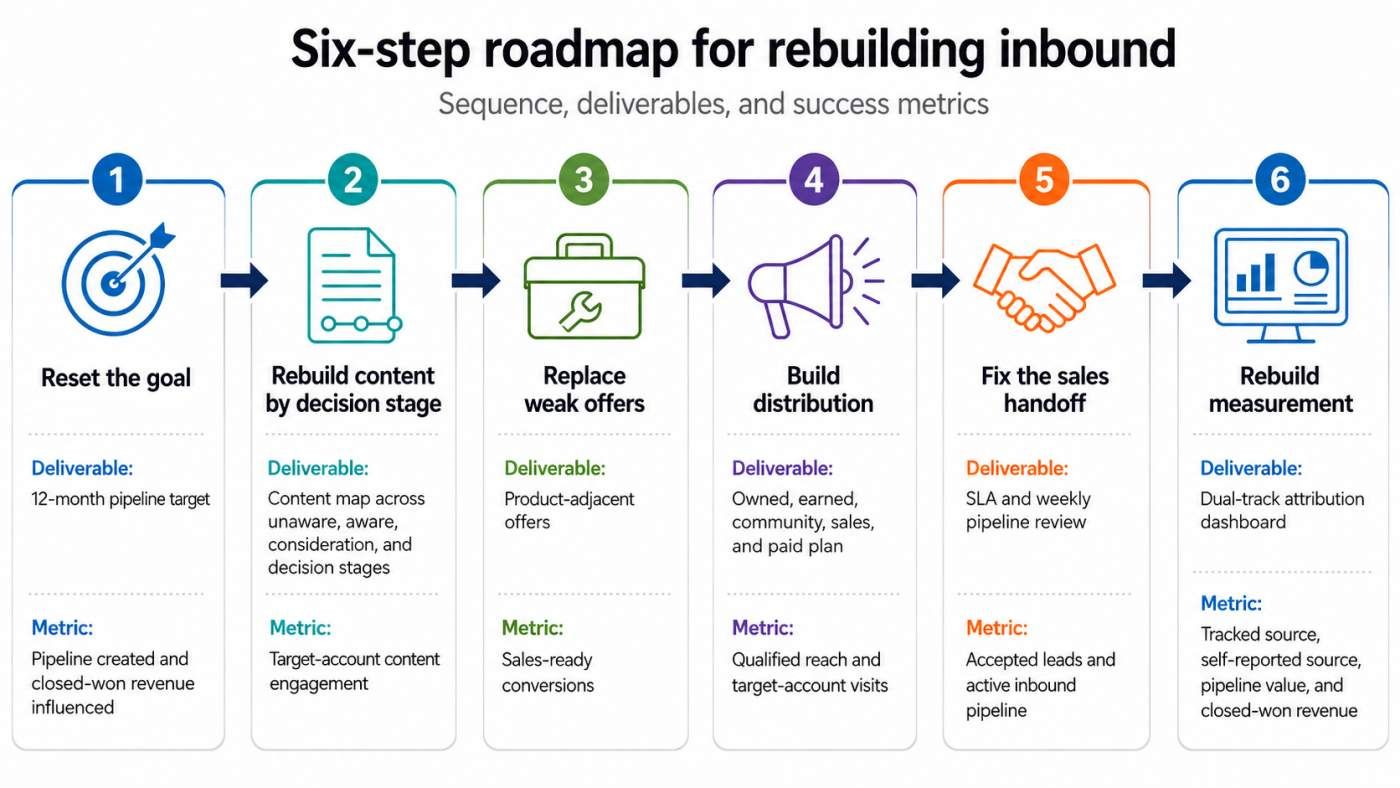
Figure 2. Six-step roadmap for rebuilding inbound
The benchmarks that tell you whether it’s working
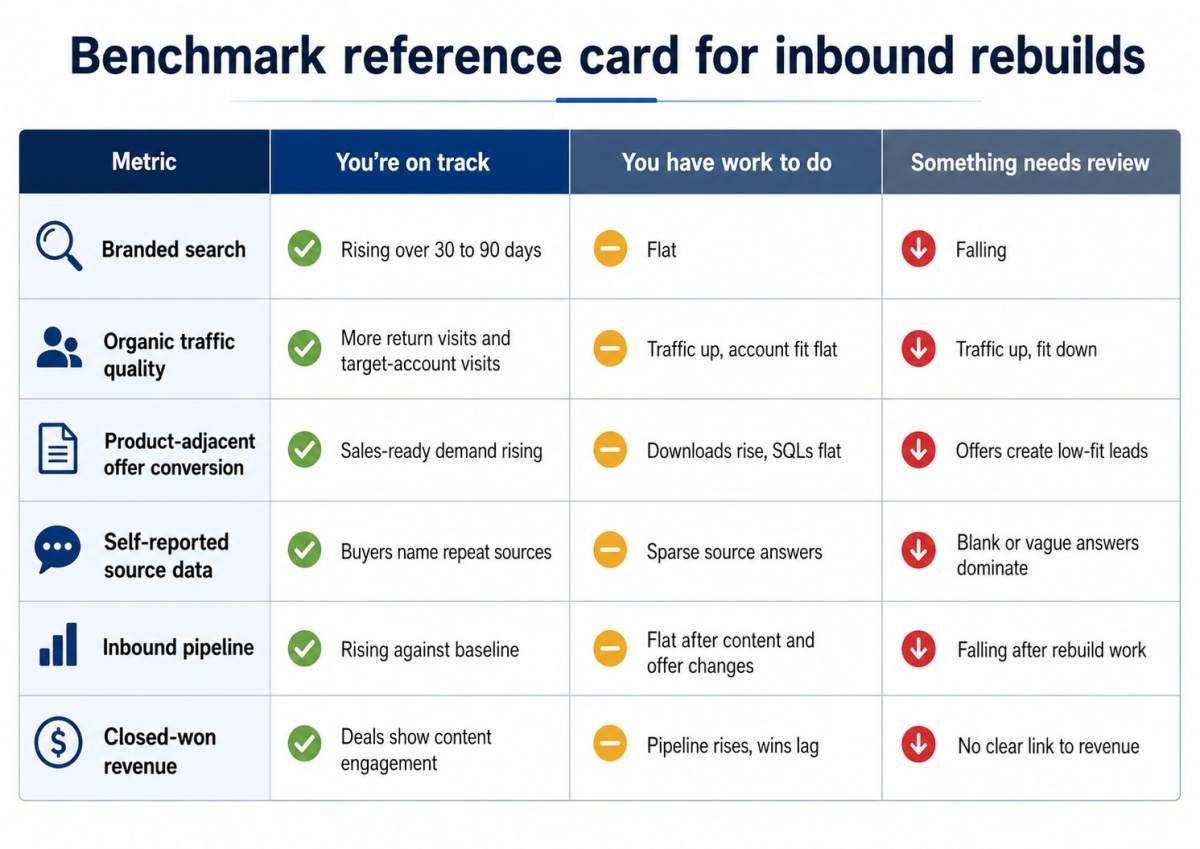
Inbound needs two sets of measures. Early measures show whether the rebuild is reaching the right buyers within 30 to 90 days. Revenue measures show whether those buyers become pipeline and closed-won revenue over 6 to 12 months.
The top 5 metrics marketers track in 2026 are lead quality and MQLs at 39%, lead-to-customer conversion rate at 34%, ROI at 31%, customer acquisition cost (CAC) at 30%, and lead volume at 29% (HubSpot, 2026b). Those metrics show that inbound marketing measurement needs more than lead volume. Marketing teams should track whether leads meet sales standards, whether they convert into customers, how much those customers cost to acquire, and whether inbound produces enough return.
Leading indicators: 30 to 90 days
Branded search volume shows whether more buyers know the company before they reach the website. This matters because buyers may research through AI tools, peer groups, reviews, LinkedIn, or podcasts before the tracking system records a visit.
Organic traffic quality gives a better read than traffic volume alone. Marketing teams should check pages per session, time on page, return visits, and visits from target accounts. Traffic has more value when target accounts return to the site and spend time on buyer-stage content.
Offer conversion rate also matters. Assessments, calculators, benchmark reports, and product-linked tools show more intent than broad downloads because they ask buyers to test fit, compare options, or solve a work problem.
Self-reported source data shows which sources buyers name before software attribution sees them. Demo forms should ask how the buyer heard about the company. Repeated mentions of the same sources help marketing teams see where off-site demand comes from.
Lagging indicators: 6 to 12 months
Lagging indicators show whether inbound activity turns into pipeline, closed-won revenue, and lower acquisition cost over 6 to 12 months. The first measure is pipeline generated from inbound, compared with the baseline before the rebuild.
Closed-won revenue with content engagement shows whether content supported accounts that became customers. Marketing and sales should check deals where the account viewed content, used an offer, returned to the site, or named content during sales calls.
Inbound-sourced CAC should decrease as lead quality improves. CAC shows how much the company spends to acquire a customer. Inbound marketing ROI shows whether that spend produces enough pipeline and closed-won revenue.
The benchmarks that are actually useful
Useful B2B inbound benchmarks vary by market, source, and sales process. Lead conversion benchmark data from inbound calls and web forms across 14 industries shows why one flat rate does not fit every program (Ruler Analytics, n.d.). Marketing teams should compare results by channel, offer type, industry, and annual contract value.
The MQL-to-SQL conversion rate gives a clearer view than the MQL count because it shows whether leads meet sales standards. It also shows whether an offer attracts real prospects or broad interest.
Inbound’s contribution to the pipeline should match the company’s market and sales model. For planning, marketing teams can use 15% to 40% as a working range, with higher levels treated as strong results. A 6-to-12-month window should show pipeline change, while 12 to 24 months gives inbound more time to produce repeat sales results.
AI use does not prove that inbound creates more pipeline. In 2026, 96% of marketers use AI, and 45% name efficiency as the top benefit (Hickey, 2026). A benchmark card should keep company leaders focused on pipeline quality, revenue, CAC, closed-won deals, and whether the company can build inbound marketing that drives revenue.
Match the fix to the real inbound problem
If inbound produces traffic but little pipeline, marketing leaders should run the six-failure-mode diagnostic before adding spend. Start with the issues that stop sales-ready demand, such as weak offers, poor distribution, slow sales follow-up, or attribution gaps.
If sales reps hear “I found you through your content,” but the dashboard gives content little credit, fix attribution first. Build the dual-track attribution dashboard before the next budget review so leaders can compare tracked source data, buyer-stated sources, pipeline, and closed-won revenue.
More B2B buyers will use AI and chat search tools in 2026, but 19% of those users feel less confident because of inaccurate or unreliable AI output. Another 61% of purchase influencers say their firm has used or will use a private AI engine to support buying (Forrester, 2025).
If your marketing team is rebuilding from zero, reset the goal and rebalance the content tiers first. Scattered or missing data, lack of strategy, and trouble showing ROI remain problems for B2B marketing teams in 2026 (Demand Gen Report, 2026). A clear inbound marketing strategy helps explain why inbound marketing fails, why leaders search for “inbound marketing not working,” and how to fix inbound marketing before they add more spend.
Schedule a strategy consultation today to build an inbound marketing program that drives revenue through stronger offers, cleaner sales handoffs, better attribution, and revenue-based measurement.
Frequently Asks Questions
Inbound produces activity without revenue when one part of the revenue path stops supporting sales. The break could sit in the content, the offer, the distribution, the sales handoff, or the attribution model. Traffic and MQL counts can look healthy while too few of those contacts have the need, account fit, budget, or timing for a real sales conversation. Find the stage where buyer interest stops turning into qualified pipeline before you spend on more content or tools.
No. What is usually dead is a weak version of it: broad blog posts, low-intent gated assets, and thin distribution that fills a dashboard with MQLs sales cannot use. Buyers still research before they buy. They just do it across more places now, from AI tools to Reddit to peer Slack groups. Inbound works when content, offers, handoffs, and reporting match how buyers actually decide.
They differ by when they start and what they do. Outbound starts contact before the buyer asks for help. Demand generation builds trust and awareness ahead of the hand raise. Inbound engages once intent becomes visible and gives the researching buyer a clear next step. All three work better when sales and marketing track the same accounts, pipeline, and revenue.
AI has moved to the front of the research process, before buyers ever reach your site. G2 found that 79% of software buyers say AI search has changed how they research, and about 3 in 10 now start with AI search more often than Google. Basic “what is” content loses value when an AI tool already answers the question. Stronger content gives proof, use cases, cost context, and clear next steps that an AI cannot settle on its own.
Usually because marketing and sales are scoring the same lead by different rules. Marketing counts a form fill or a score threshold as an MQL, while sales wants a clear buying problem, account fit, timing, and budget. When MQL volume rises but SQLs, opportunities, and closed deals stay flat, the issue is lead quality, not lead volume. Fix it with a written SLA that defines what makes a lead sales-ready, how fast sales responds, and how reps send quality feedback back to marketing.
Because tracked attribution only sees the last digital step, not the research that happened in private. Buyers ask peers, hear a podcast, read a LinkedIn post, or use an AI answer, then arrive through direct or branded search, and the report credits that final source. Refine Labs found a 90% gap between software attribution and what buyers actually reported, with podcasts credited 0% by software but 53% of revenue by buyers themselves. Add self-reported attribution, a simple “How did you hear about us?” field, alongside your tracked data to see the full picture.
Watch two sets of signals on two timelines. In the first 30 to 90 days, leading indicators like branded search volume, organic traffic quality from target accounts, offer conversion rate, and self-reported sources show whether you are reaching the right buyers. Over 6 to 12 months, lagging indicators (pipeline generated from inbound, closed-won revenue tied to content engagement, and a falling inbound CAC) show whether those buyers turn into revenue. Lead volume alone tells you almost nothing.
Resources
- 6sense. (2025). The B2B buyer experience report for 2025. https://6sense.com/science-of-b2b/buyer-experience-report-2025/
- Atli, E. (2025, December 15). The state of first-touch, last-touch, self-reported attribution and revenue. HockeyStack Labs.https://www.hockeystack.com/lab-blog-posts/state-of-revenue
- Bailyn, E. (2025, August 1). Lead-to-MQL conversion rate benchmarks by industry & channel. First Page Sage. https://firstpagesage.com/reports/lead-to-mql-conversion-rate-benchmarks-by-industry-channel-fc/
- Bray, M. (2026, April 10). 2026 state of marketing: Data from 1,500+ global marketers. HubSpot.https://blog.hubspot.com/marketing/hubspot-blog-marketing-industry-trends-report
- CaliberMind. (2025). 2025 edition state of marketing attribution report. https://calibermind.com/wp-content/uploads/2025/06/2025-State-of-Marketing-Attribution-Report.pdf
- Davidoff, D. (2014, August 21). The 3 reasons your inbound marketing efforts are failing. Lift Enablement.https://www.liftenablement.com/blog/why-inbound-marketing-fails
- Demand Gen Report. (2026). The state of B2B marketing: Trends and insights in 2026. https://www.demandgenreport.com/resources/the-state-of-b2b-marketing-trends-and-insights-in-2026/52008/
- Forrester. (2025, October 28). Forrester’s 2026 B2B marketing, sales, and product predictions: B2B companies will lose more than $10 billion because of ungoverned use of generative AI. https://www.forrester.com/press-newsroom/forrester-b2b-marketing-sales-product-2026-predictions/
- G2. (2025). Buyer behavior report 2025. https://images.g2crowd.com/uploads/attachment/file/1470753/2025-G2-Buyer-Behavior-Report.pdf
- Hickey, J. (2026, March 4). Demand Gen Report’s 2026 B2B Trends Research Report is live. Demand Gen Report.https://www.demandgenreport.com/industry-news/feature/demand-gen-reports-2026-b2b-trends-research-report-is-live/52002/
- HockeyStack. (2024, July 30). HockeyStack’s self-reported attribution report, 2024. LinkedIn. https://www.linkedin.com/pulse/hockeystacks-self-reported-attribution-report-2024-hockeystack-idjde
- HubSpot. (2026a). The 2026 state of marketing report. https://www.hubspot.com/state-of-marketing
- Refine Labs. (2023, April 7). Refine Labs study confirms measurement gap in software-based attribution & releases hybrid attribution framework. https://www.refinelabs.com/article/hybrid-attribution-framework

Kim Greer
OFP Law
One of the best business decisions I ever made was to contract with 321 Web Marketing. Jonathan Gessert and his team are knowledgeable, efficient, and effective, making digital marketing goals easy to achieve and helping [...]

Kelly Cole
Business Benefits Group
My company hired 321 Web Marketing in February 2016 to resurrect our web site. We feel our web site is the face to our business and desperately needed a make over. 321 took us from blah to WOW effortlessly and what a difference [...]

Emily Hawkins
Diener & Associates
Thanks to 321 Web Marketing, the client has seen an increase in their search engine leads, averaging 12 qualified leads per month. The client has also achieved prominent Google Maps and search placement. The team [...]

Trevor Telesz
Paw Pals Pet Sitting
321 Web Marketing successfully translated the client’s design into a stunning and refreshed website, ensuring seamless functionality across all dynamic views. The team provided clear timelines and stuck to them, [...]

Corey Davis
Spartan Animal & Pest Control
321 Web Marketing is truly phenomenal at what they do. Their ability to communicate and describe the steps and actions that they are implementing, Alex Zarpas in particular, is excellent. Delivering on promises is all [...]

Alec Roberts
MFE Insurance
I can’t say it enough, Jonathan and his team have gone above and beyond since day one to accommodate our needs and meet our goals. I run a specialty insurance brokerage based in LA and once we found 321 we never looked [...]

Richard Wilbur III
Advantage.Tech
Thanks to 321 Web Marketing’s web development work, the client increased rankings and traffic from search engines. Also, their business secured prominent positions on Google Maps and industry-relevant, profitable [...]

Bruce Gemmill
FVCbank
After the website revamp, the client saw a steady rise in leads from search engines, resulting in additional traffic. 321 Web Marketing is highly punctual when it comes to deliverables, and internal stakeholders are [...]

Drew Weeks
VAE
321 Web Marketing delivered a sleek website that accurately portrays the size and quality of the client’s organization. All of their completed websites have received positive feedback from users who have been [...]

Ryan Masten
Masten Pools
321 Web Marketing has increased the client’s leads from zero to 53 monthly. Their SEO efforts pay off impressively due to a top-ranking position on Google and making the site the number one result for several [...]